ImportCRM
Every import batch costed down to the unit — cargo, customs and cashbacks included — so three co-owners see real margin before they sell.
- Landed cost per unit
- Ordered vs received
- Expected profit before saving
- Audit trail per co-owner
- Client
- Private electronics import business
- Year
- 2025–26
- Authorship
- Own build
- Status
- Role
- Sole developer: data model, API, interface and deployment.
- Surfaces
- Web admin · desktop and phone
- Languages
- RU
- Stack
- React 18 · Vite · React Router · Node.js · Express · Prisma · PostgreSQL · JWT · Vercel
- Links
- Walkthrough on request
Survey — context and problem.
The problem
Three co-owners importing electronics couldn’t see a unit’s real cost once cargo, customs and cashbacks were added.
A small electronics import business, run by three co-owners, buys VR headsets, smartwatches, consoles and accessories from eBay, Amazon, official stores and Alibaba, then resells them locally through Instagram, Telegram, in person and on marketplaces. All the money is in US dollars.
Before ImportCRM, tracking was manual. Once cargo, customs and insurance were added on top of the purchase price, nobody could say what a single unit really cost, so real profit was a guess. Short shipments blurred the line between what was ordered, what arrived and what was actually in stock. Cashbacks from platforms and producers arrived weeks later and were easy to lose. And with three partners entering data at the same time, there was no record of who changed what.
The requirements were fixed in a detailed specification (v3.2, December 2025): batches as the unit of accounting, ordered-versus-received tracking, cost allocation, profit on every sale, a full audit trail and equal rights for all three co-owners.
Plan — the system, drawn first.
The solution
A batch-based CRM that allocates landed cost to every unit, shows expected profit before a sale is saved and logs every change by partner.
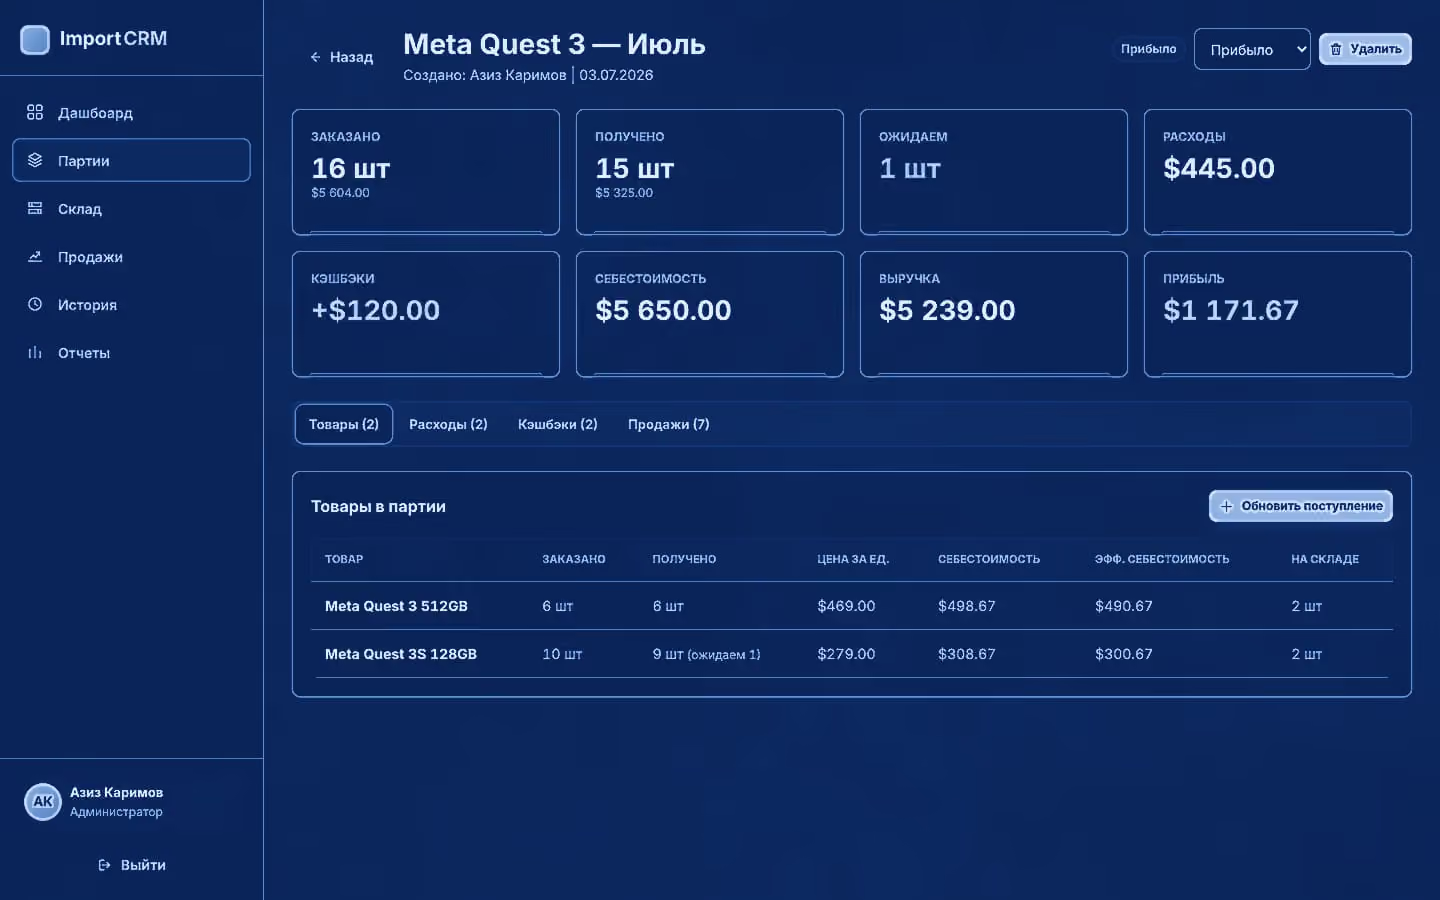
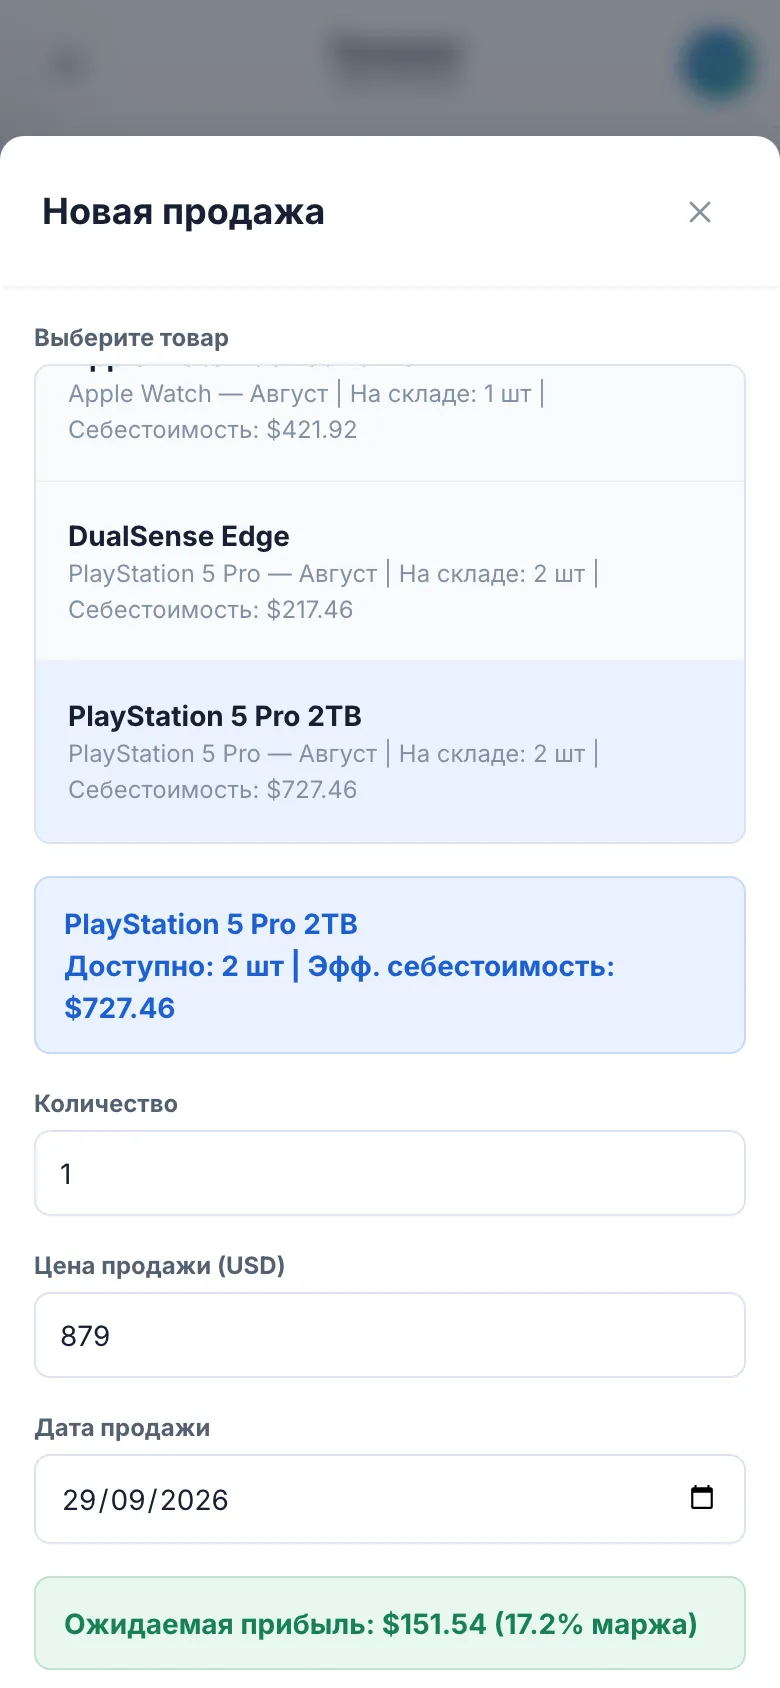
ImportCRM treats every import batch as the unit of accounting. A batch holds its products with expected quantity and unit price; arrivals record what actually came, with shortage notes, and move the batch status automatically. Cargo, customs and insurance are added as batch expenses, and platform or producer cashbacks move from pending to applied. A landed-cost engine re-runs on every arrival, expense or cashback and writes base and effective cost for each unit. Sales are tied to physical stock: the dialog shows expected profit and margin before saving, the server snapshots cost and profit at that moment, and a cancellation restores inventory. Every create, update, delete and sign-in lands in an audit log with old and new values. The same Express app runs locally and as a Vercel serverless function over Postgres.
Module key
- Import batches with products, ordered-vs-received tracking and automatic status
- Batch expenses (cargo, customs, insurance) and cashbacks from pending to applied
- Base and effective cost per unit, recalculated on every change
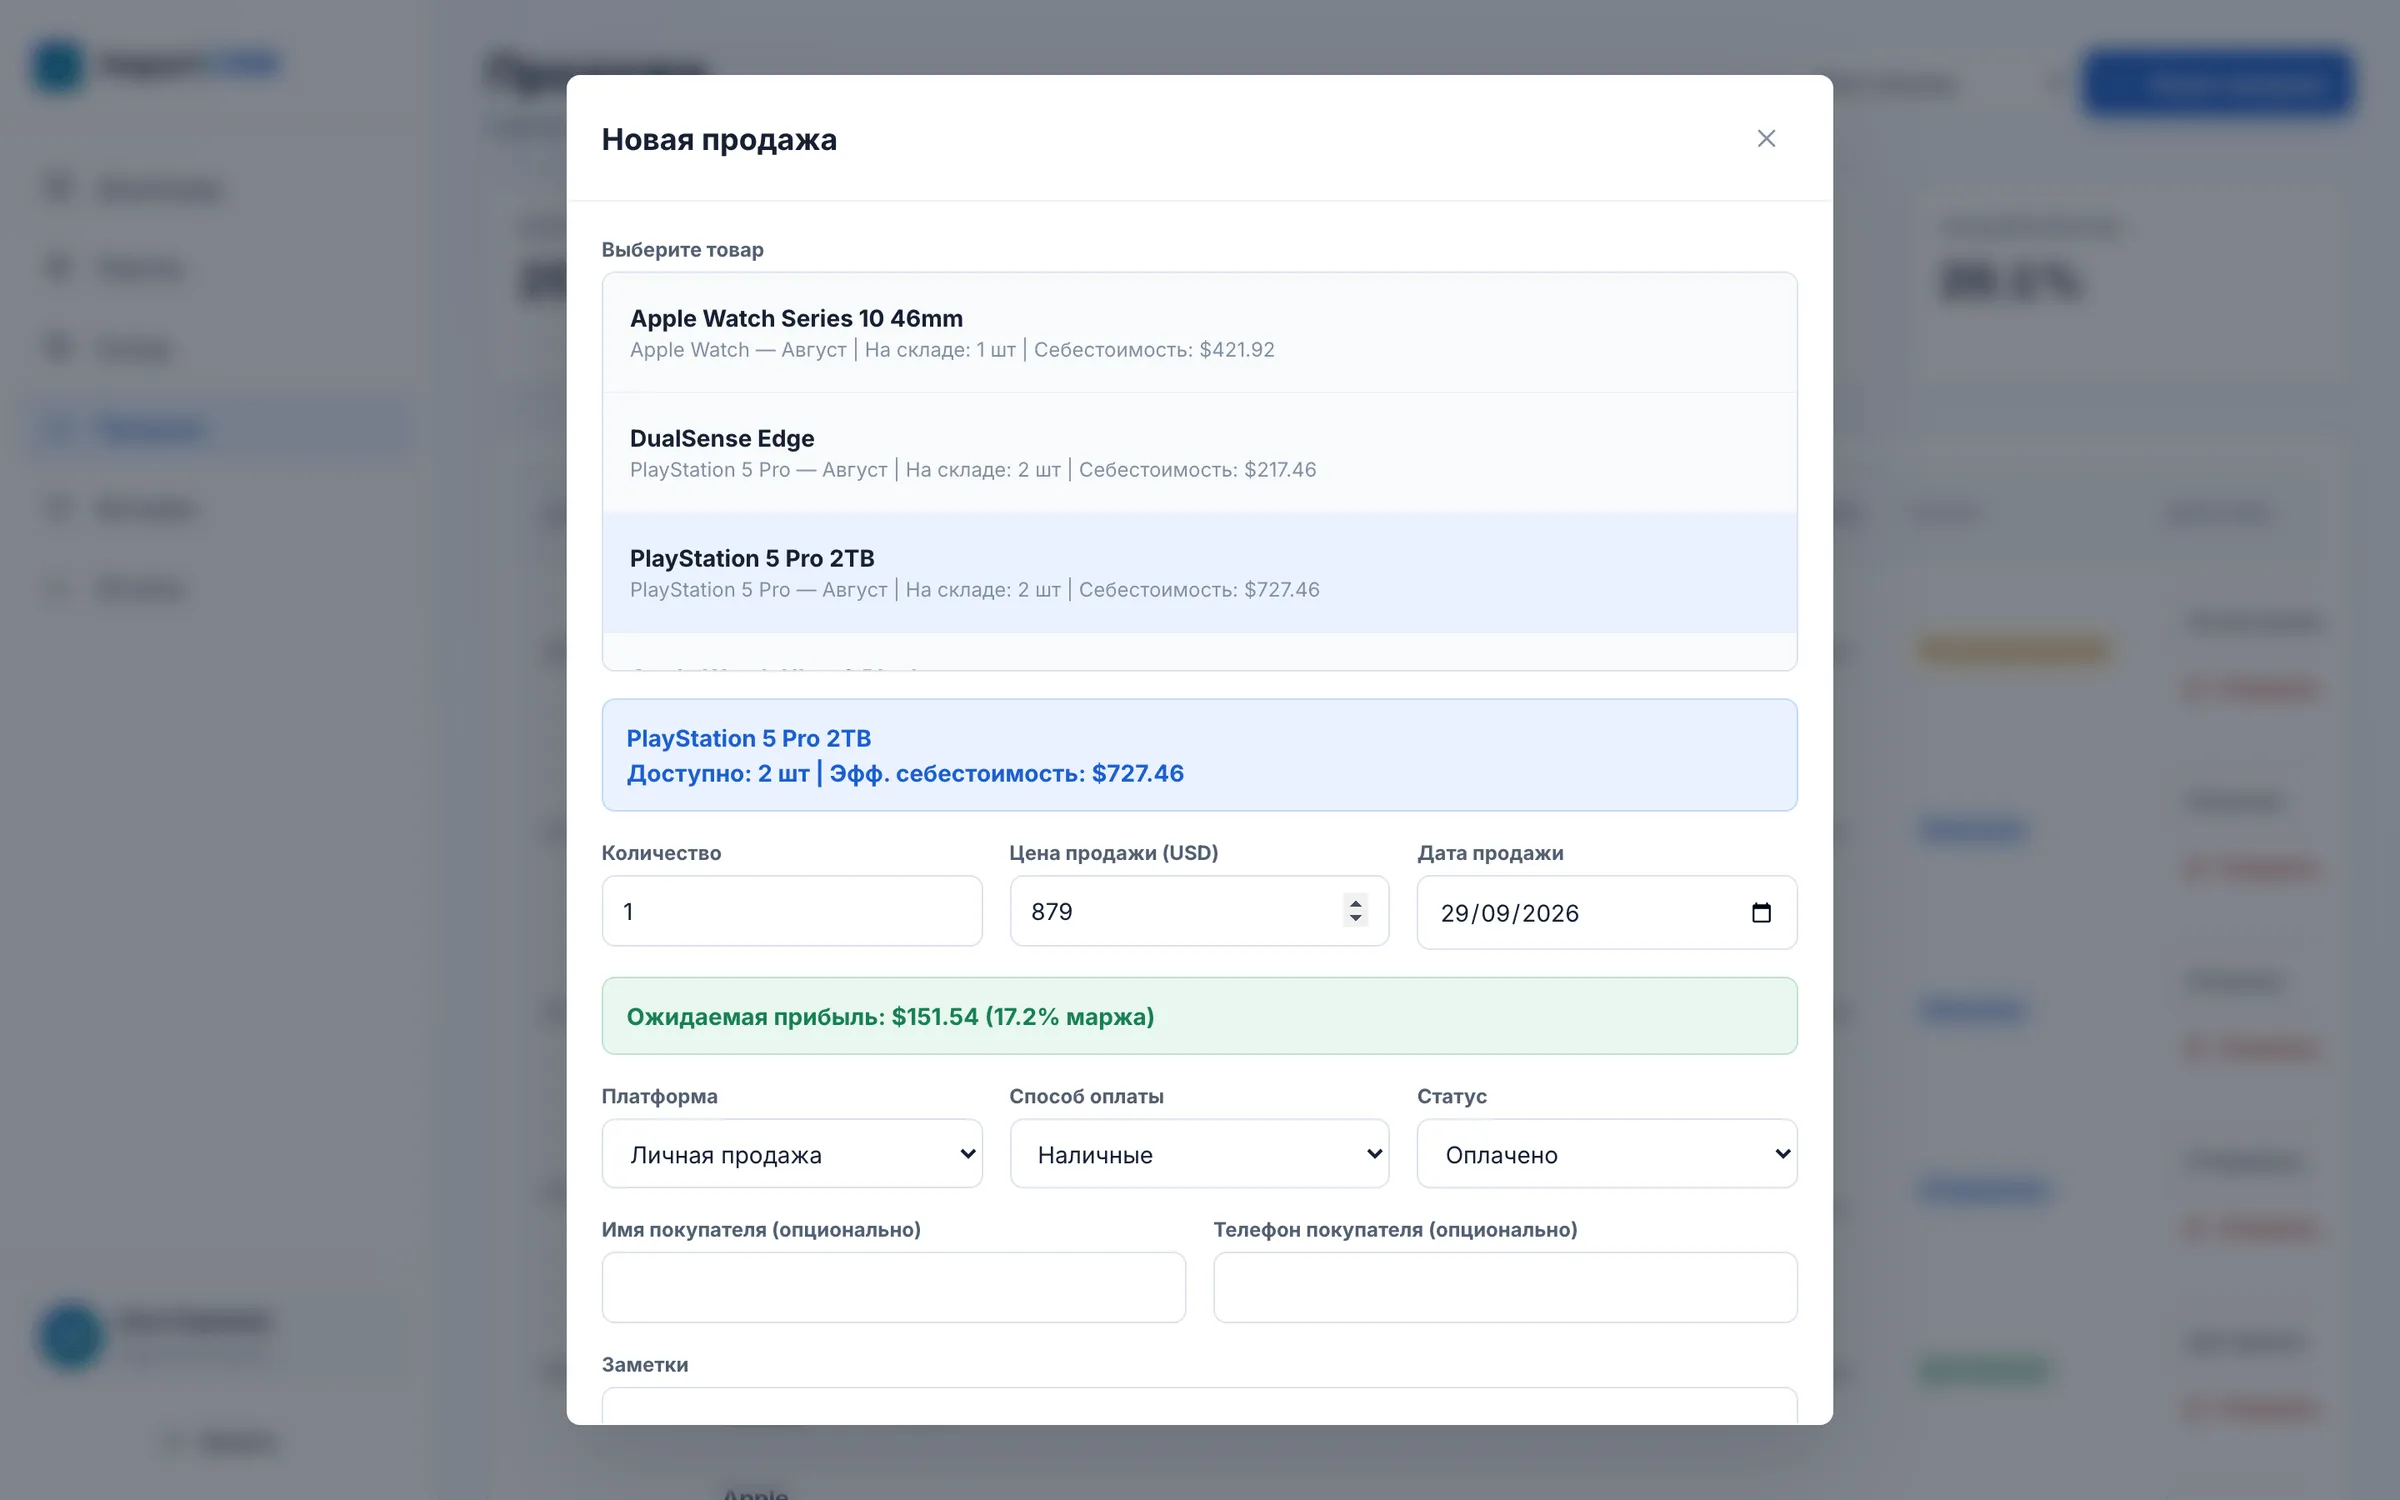
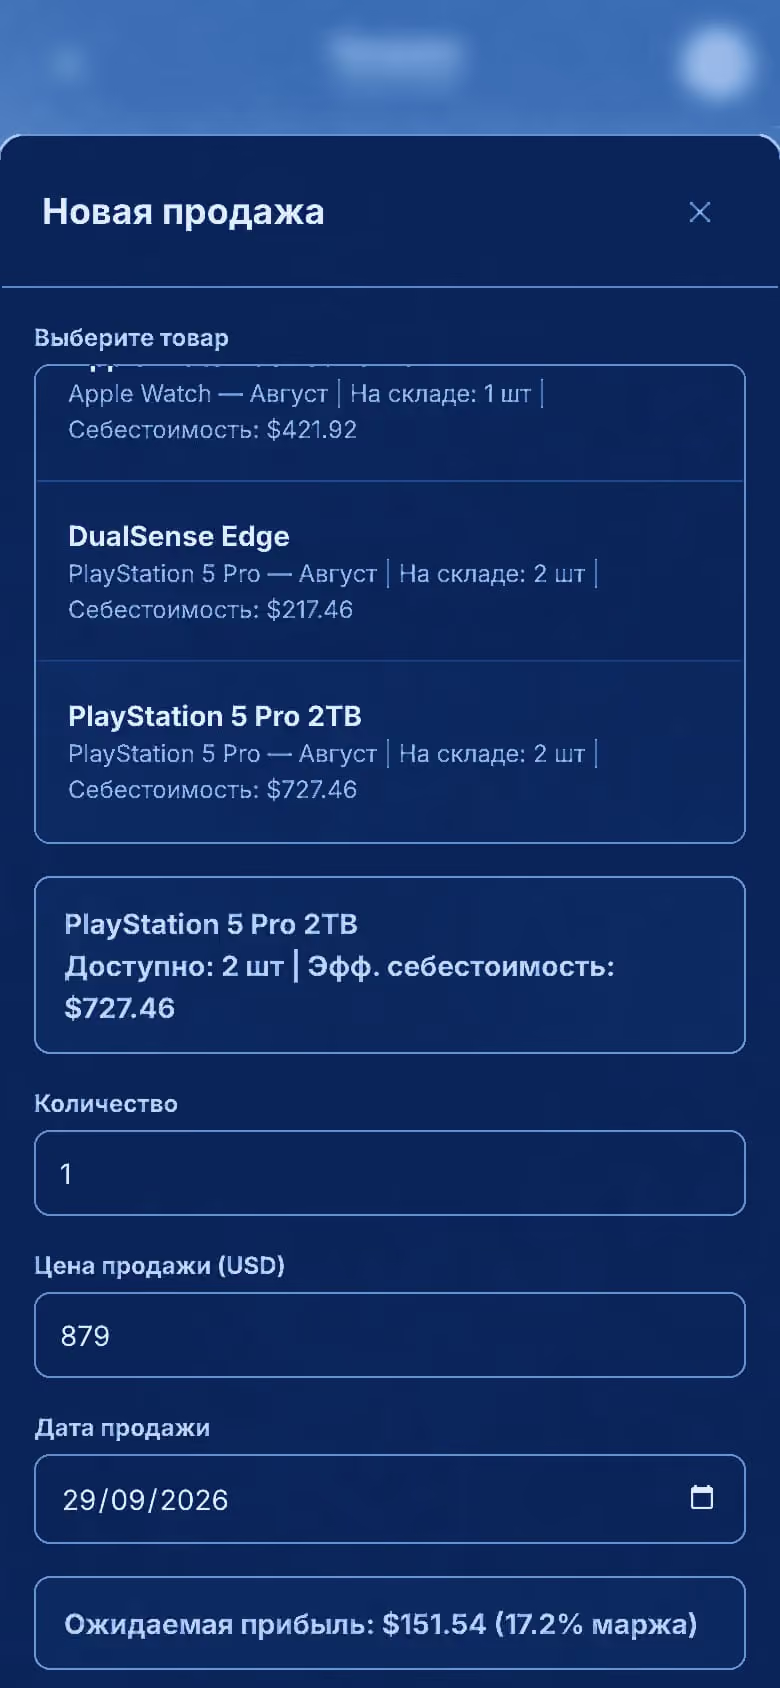
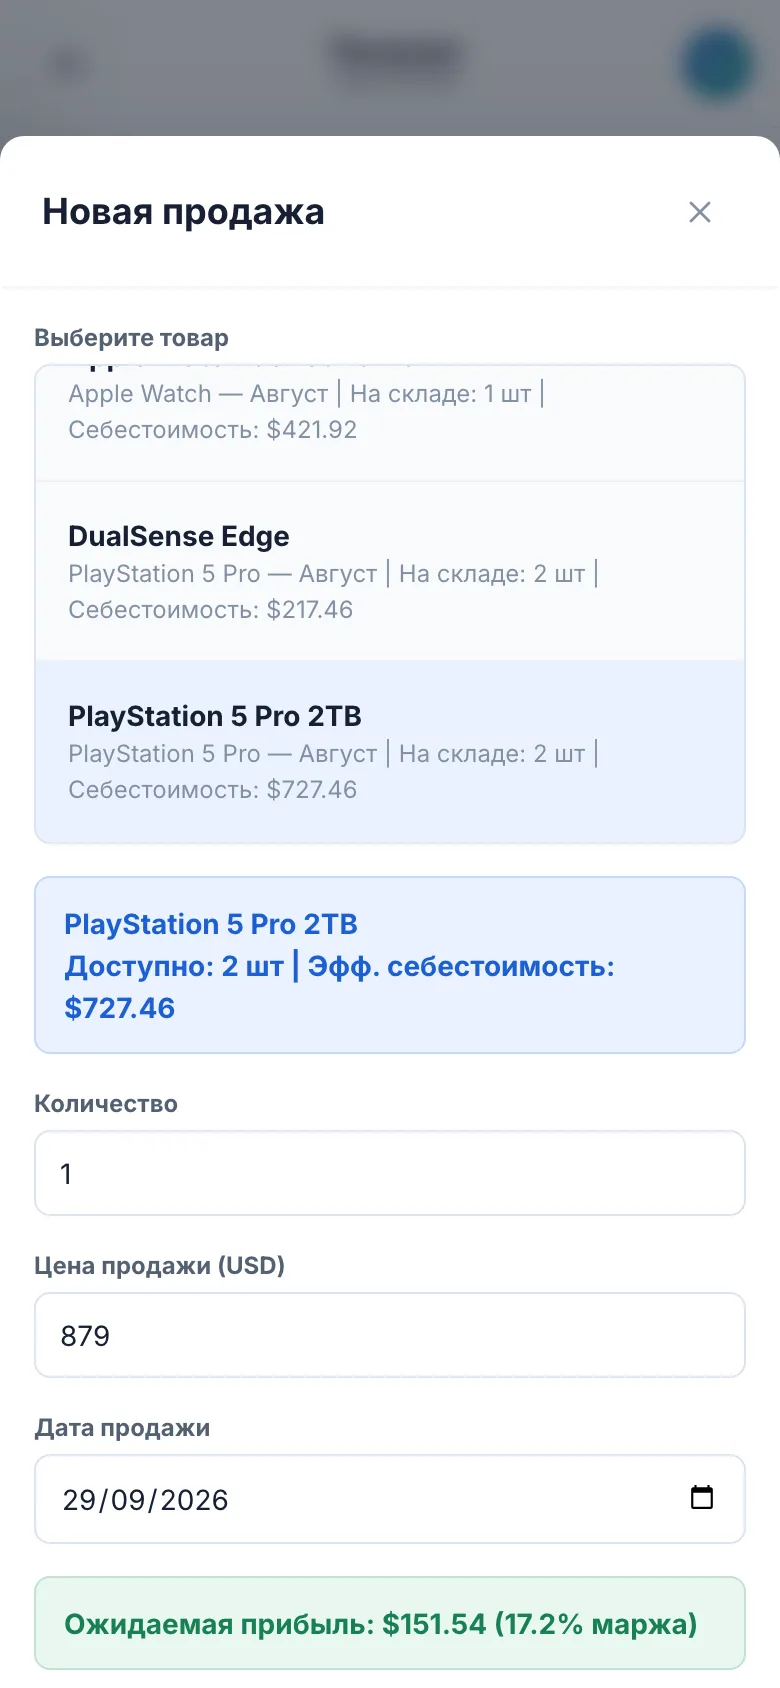
- New-sale dialog with live expected profit and margin; overselling is refused
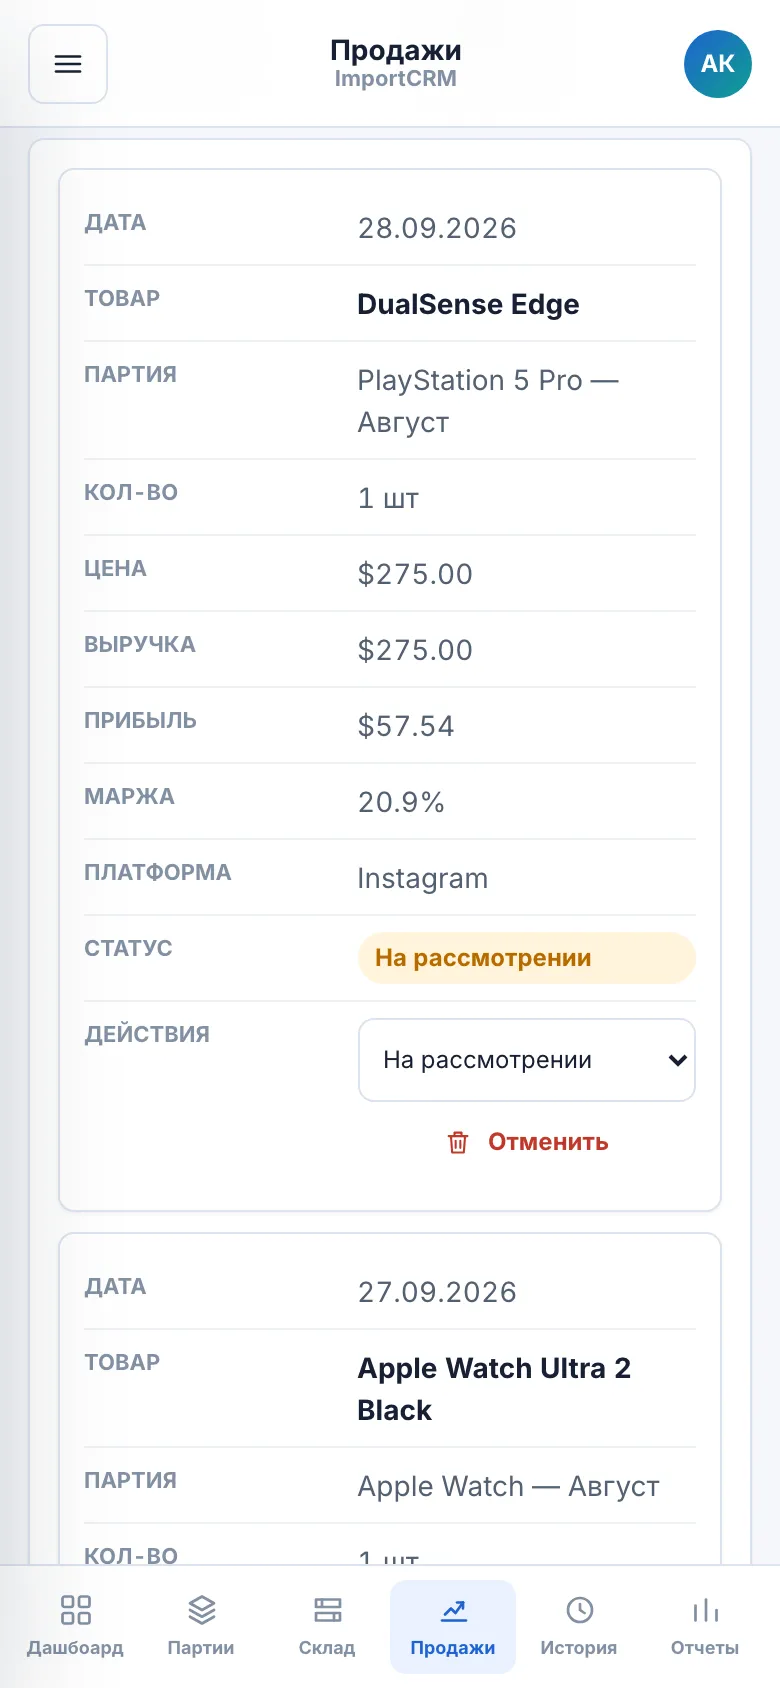
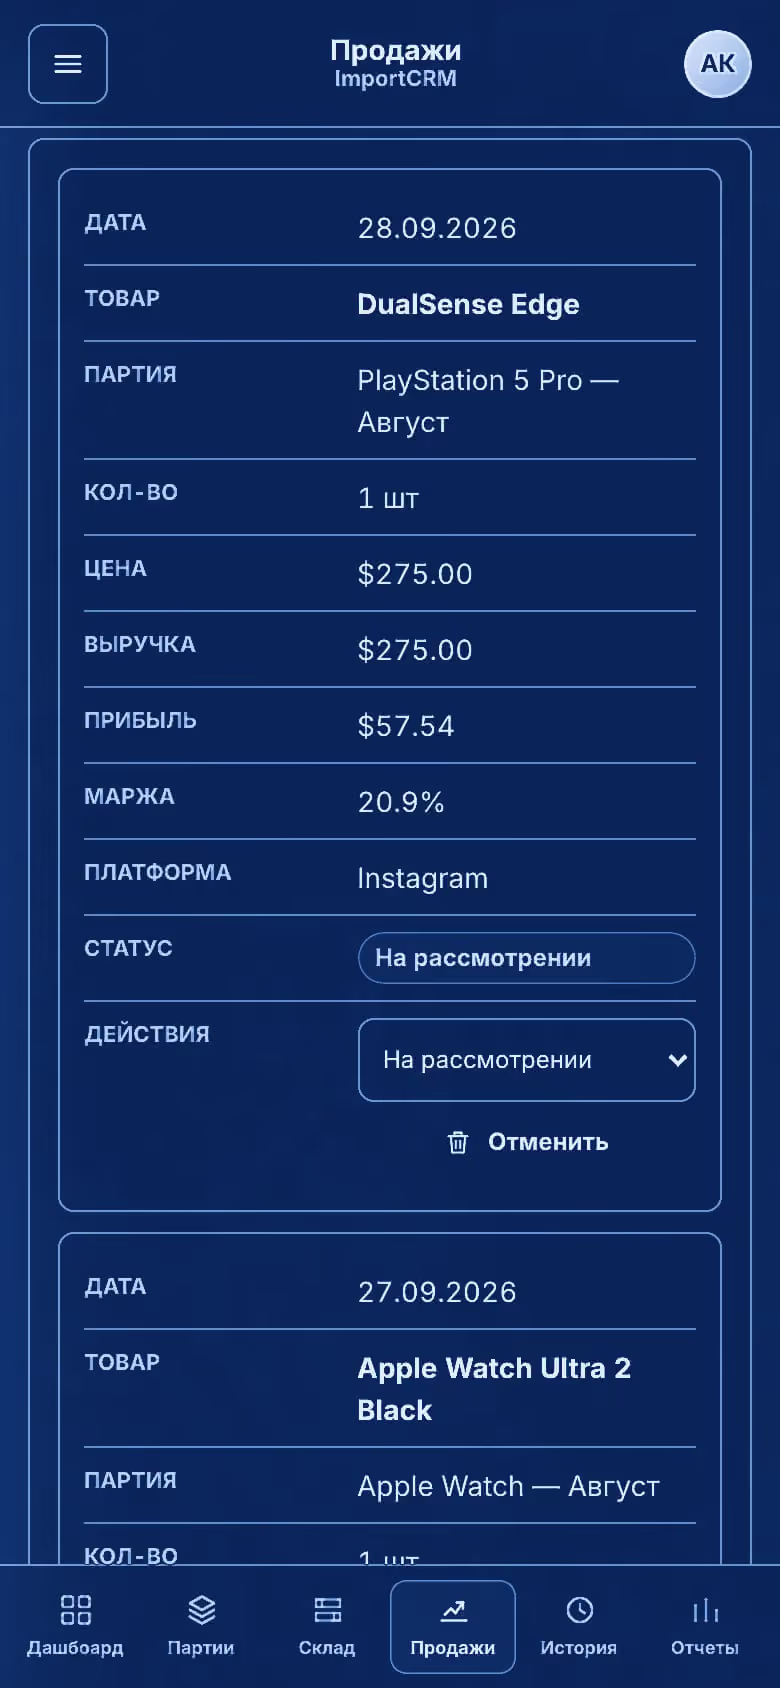
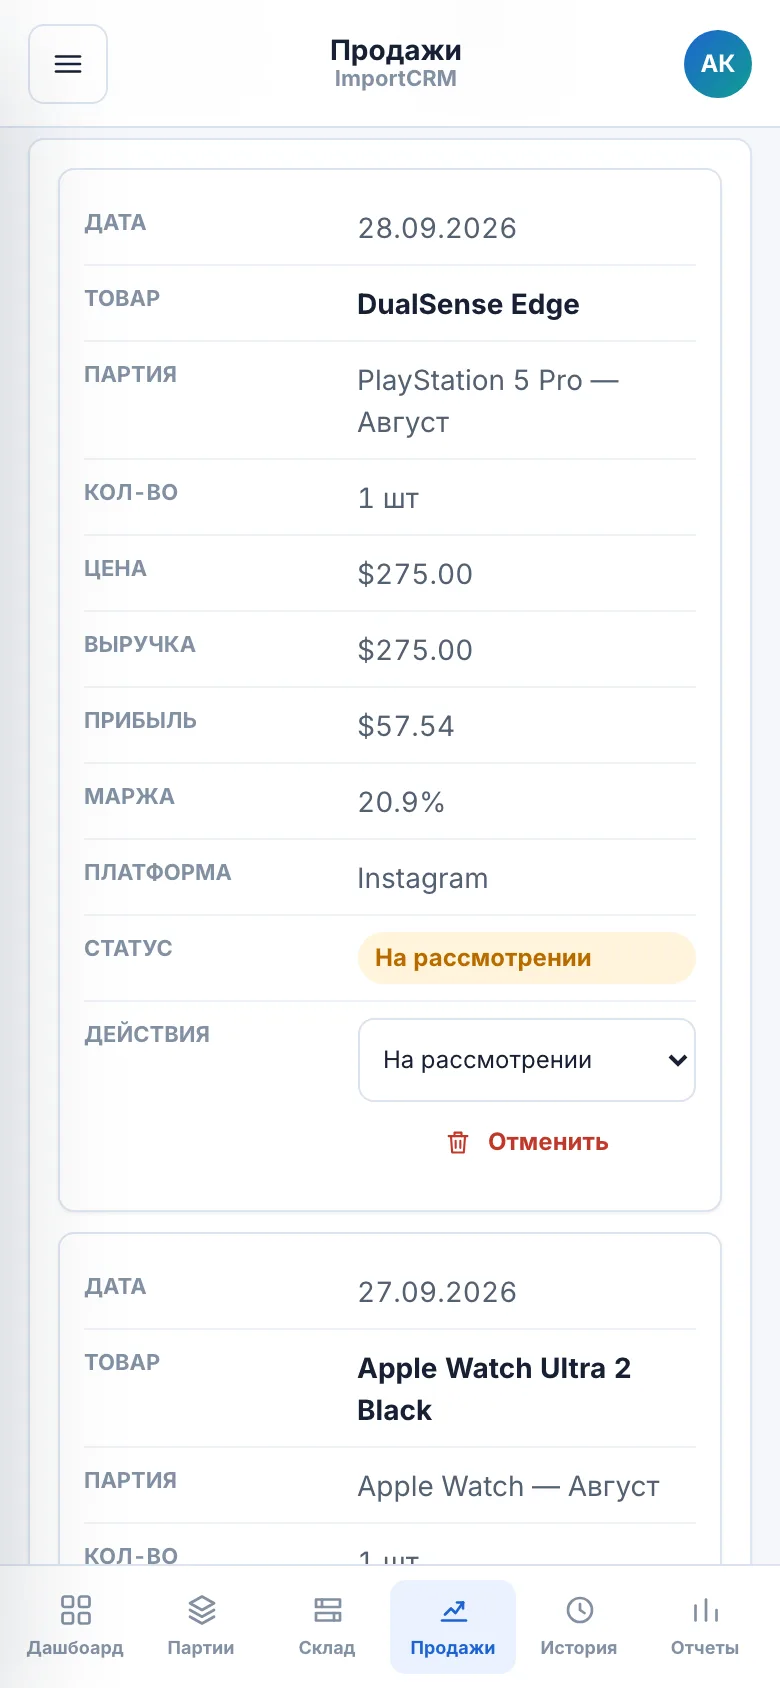
- Sale cancellation that restores stock and logs the change
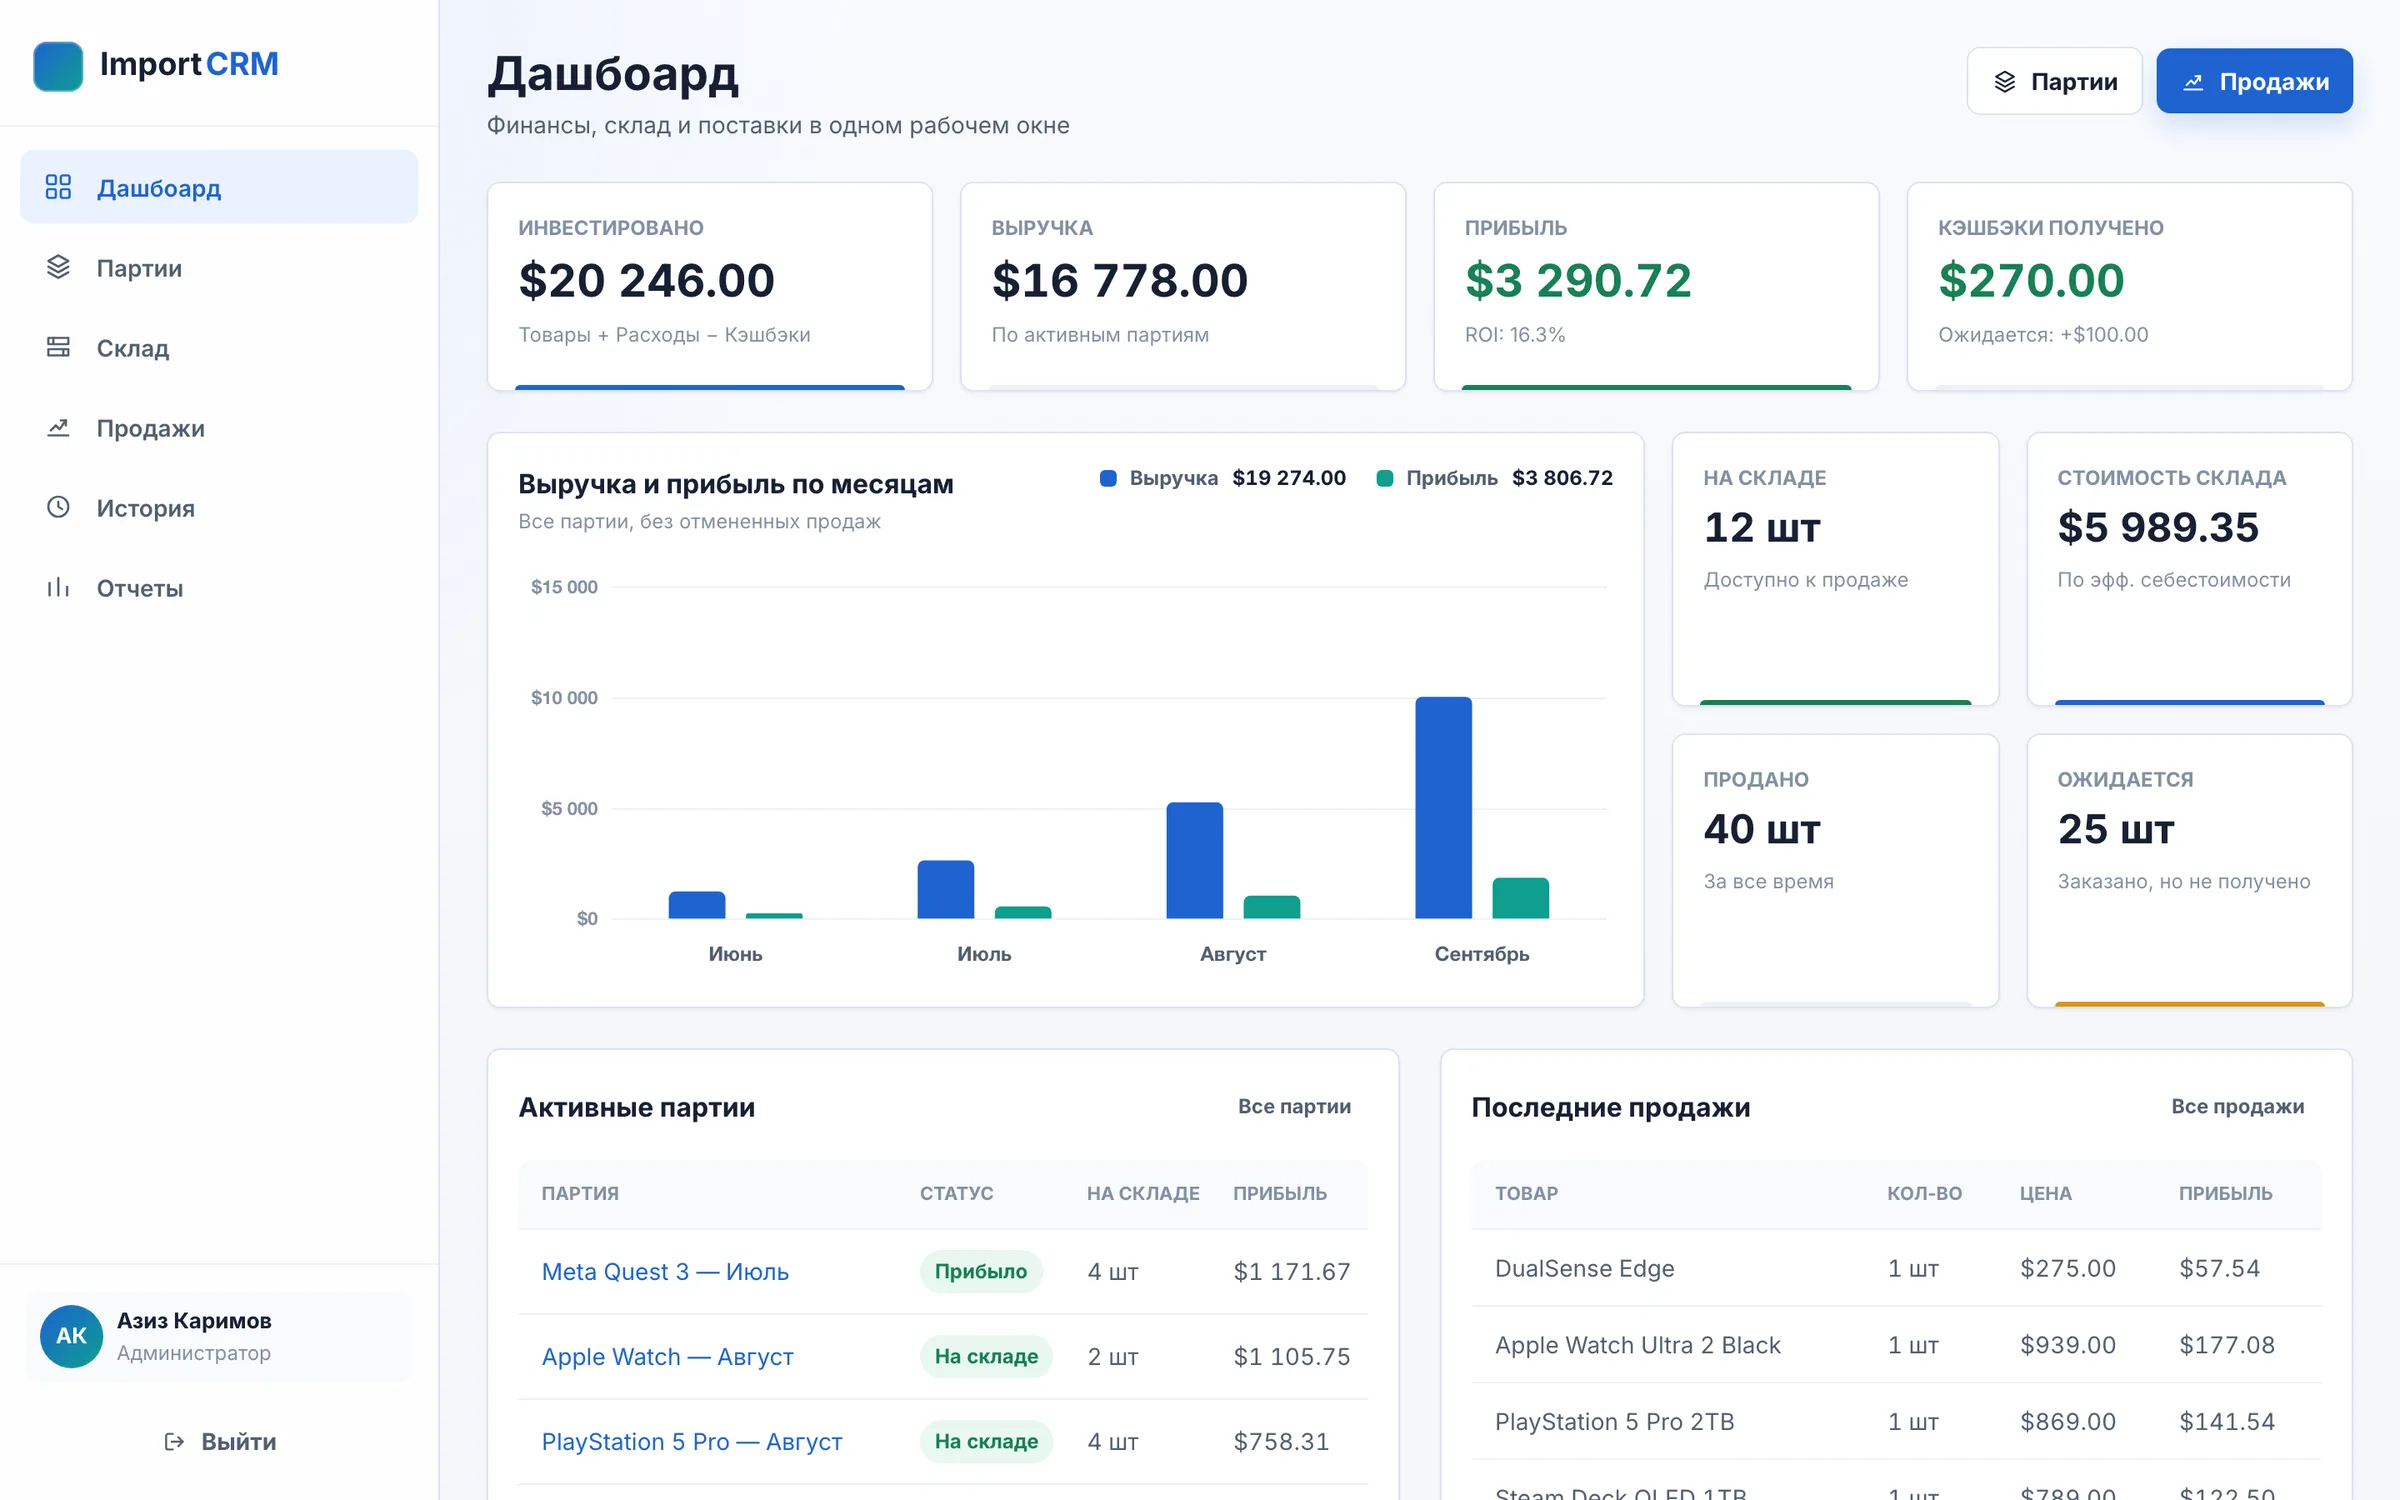
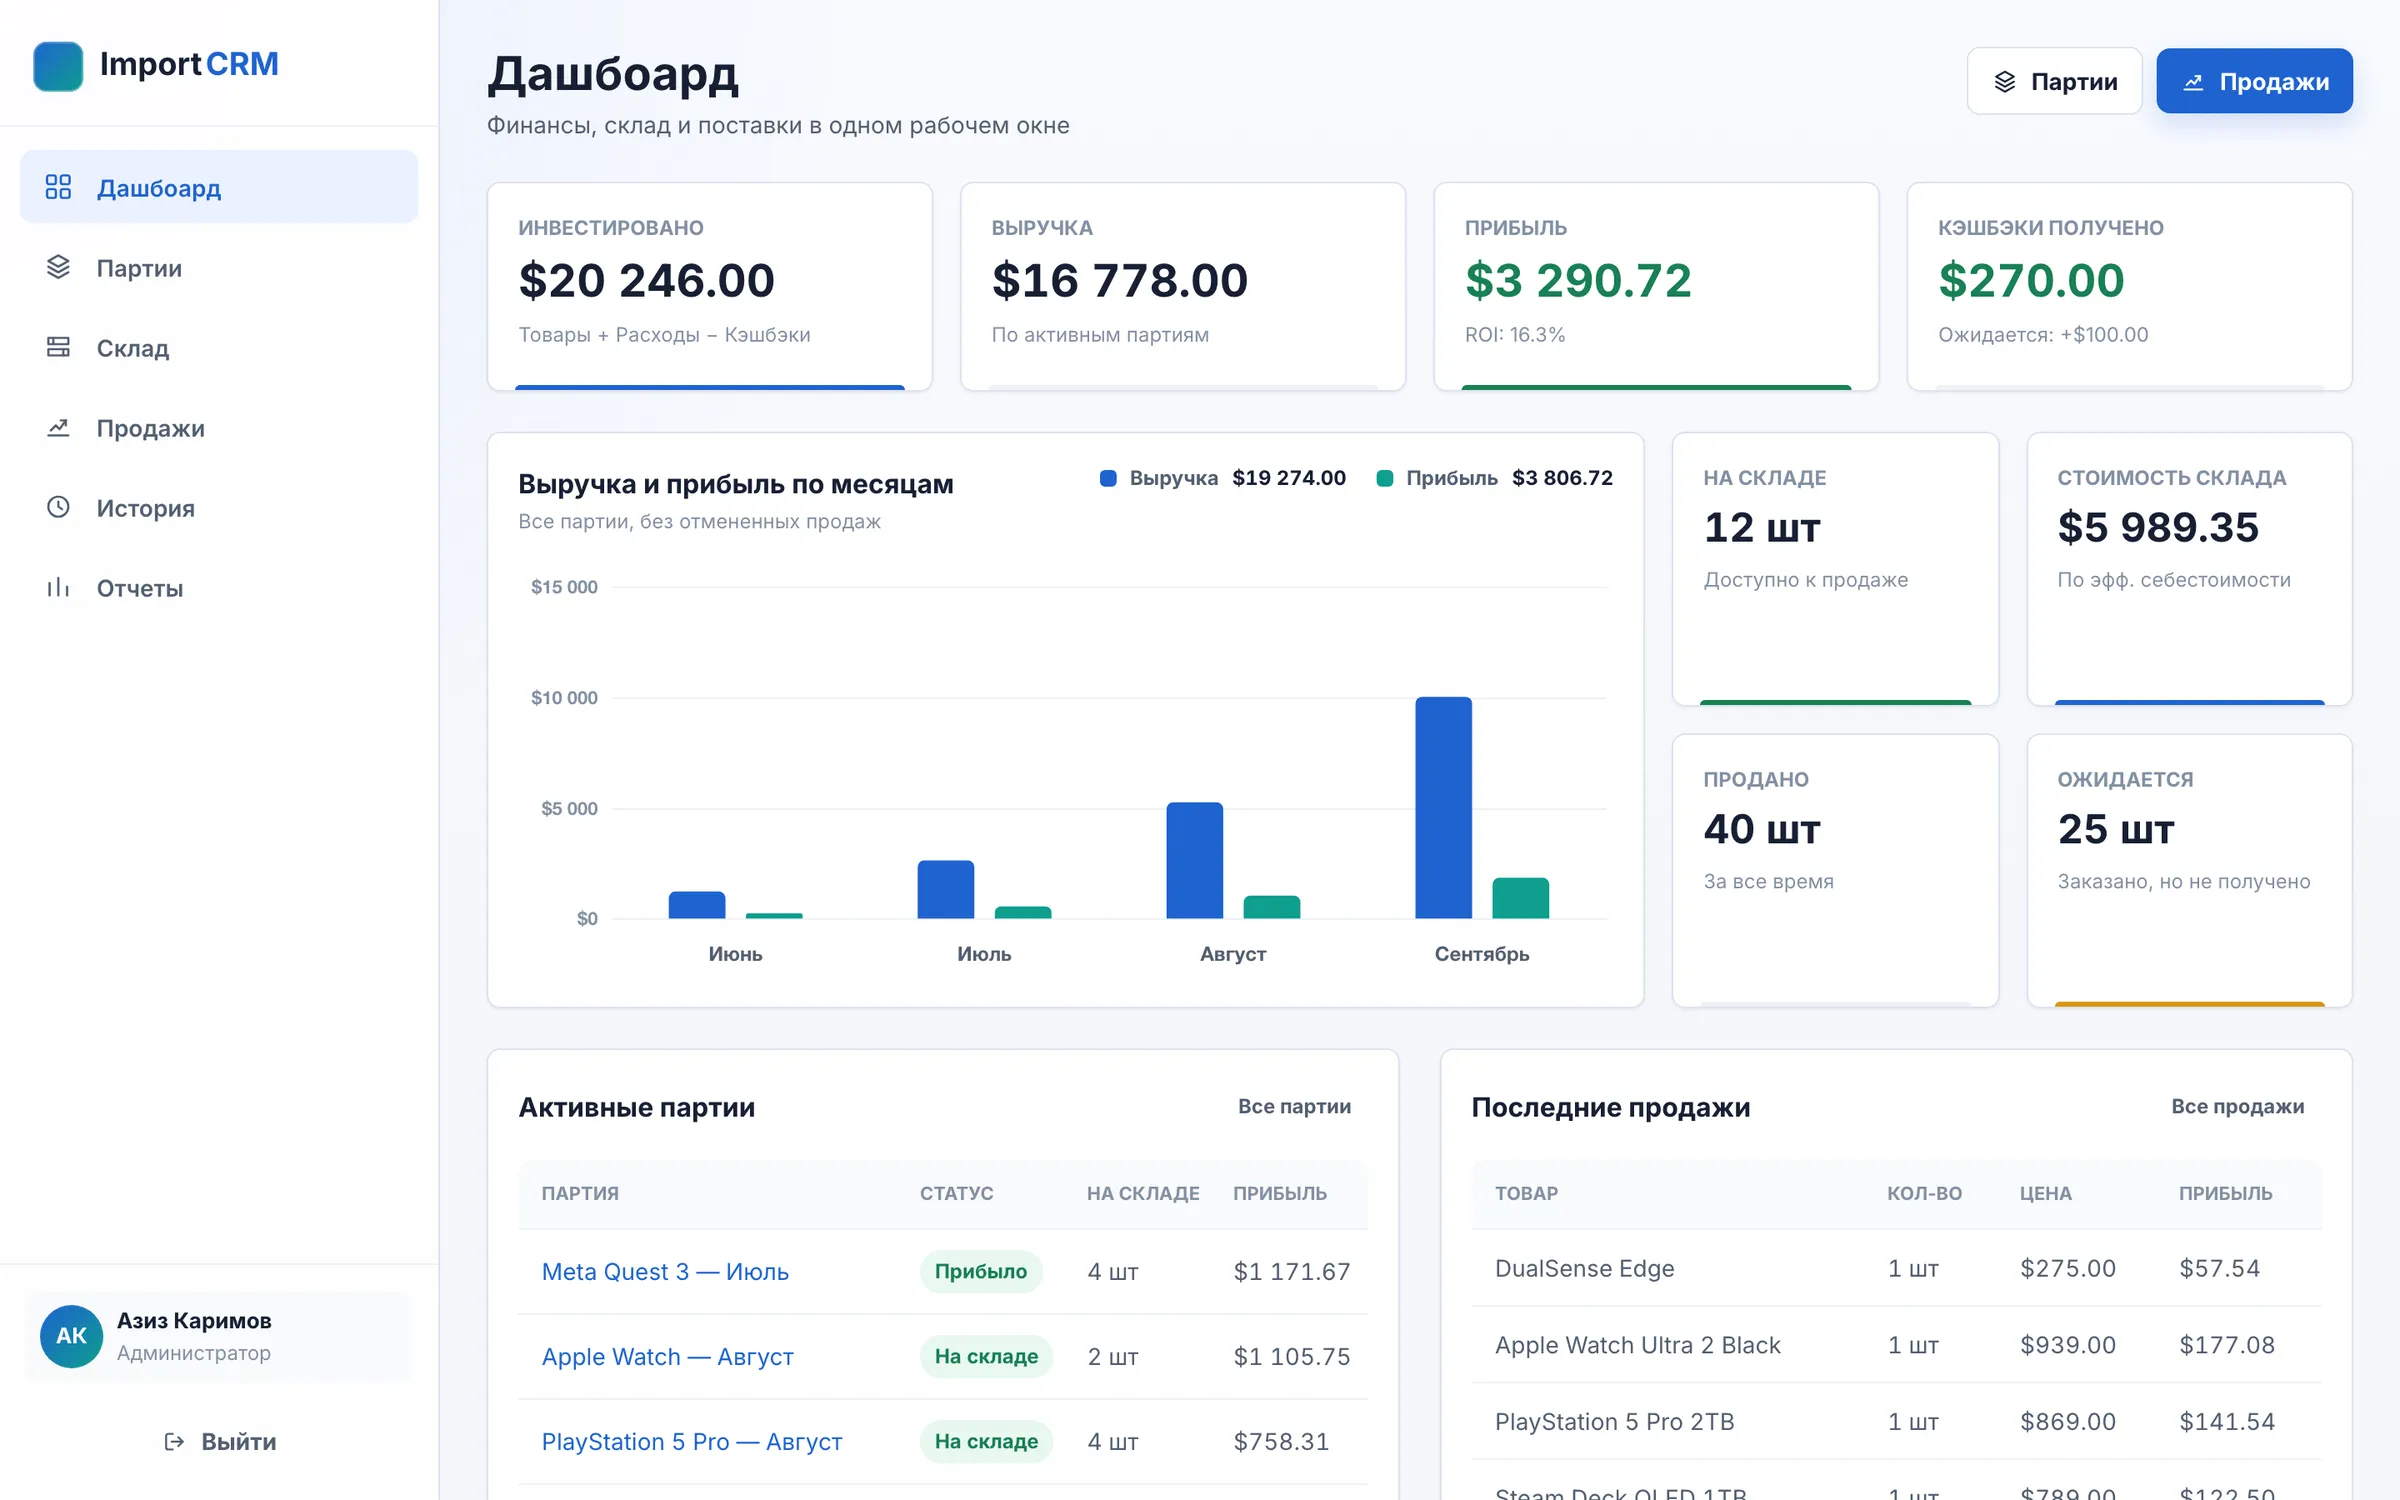
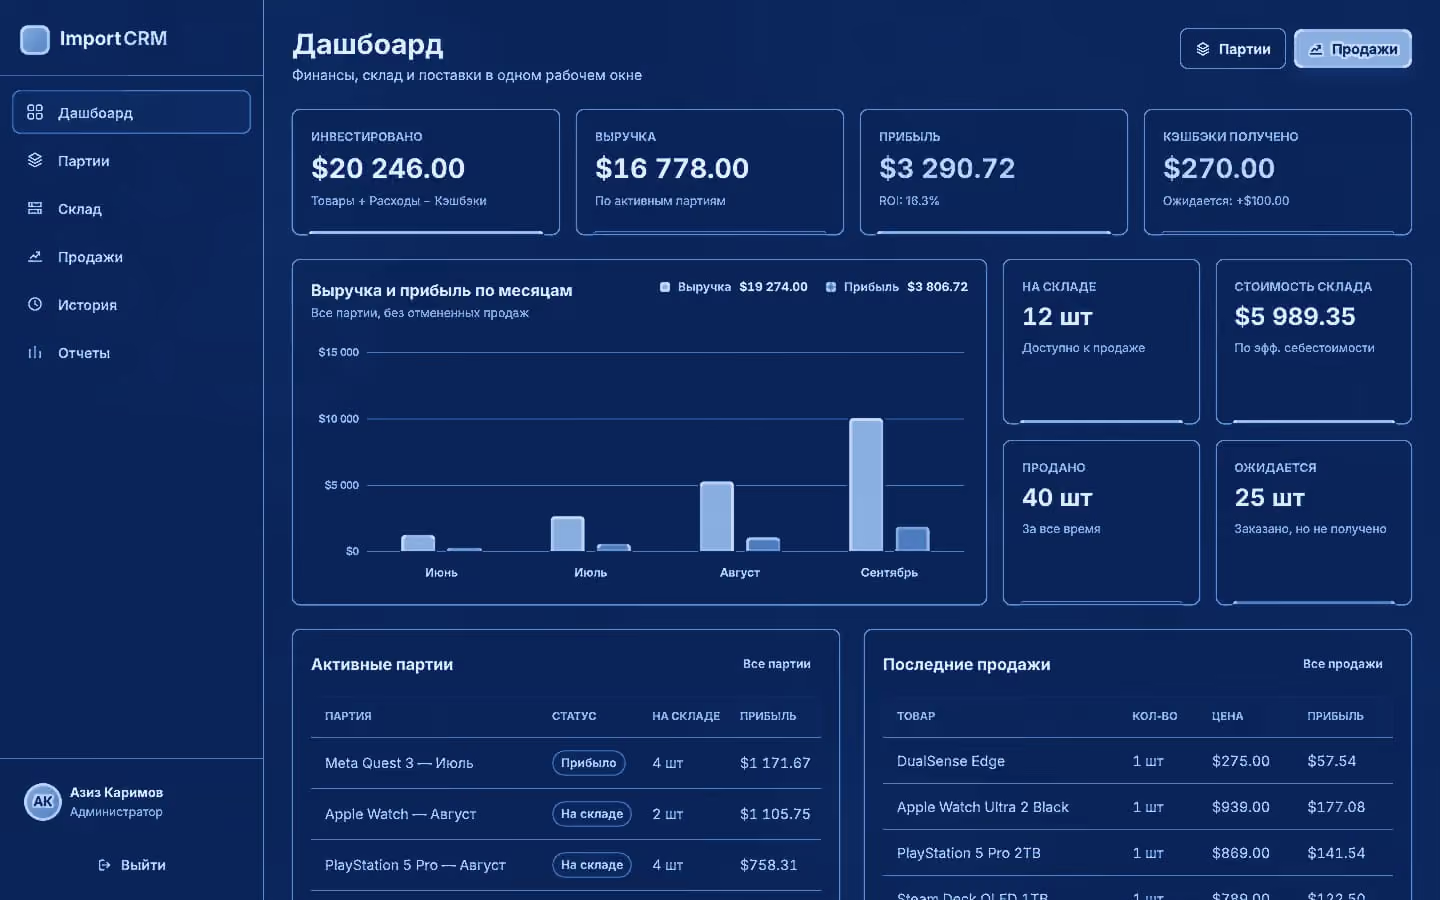
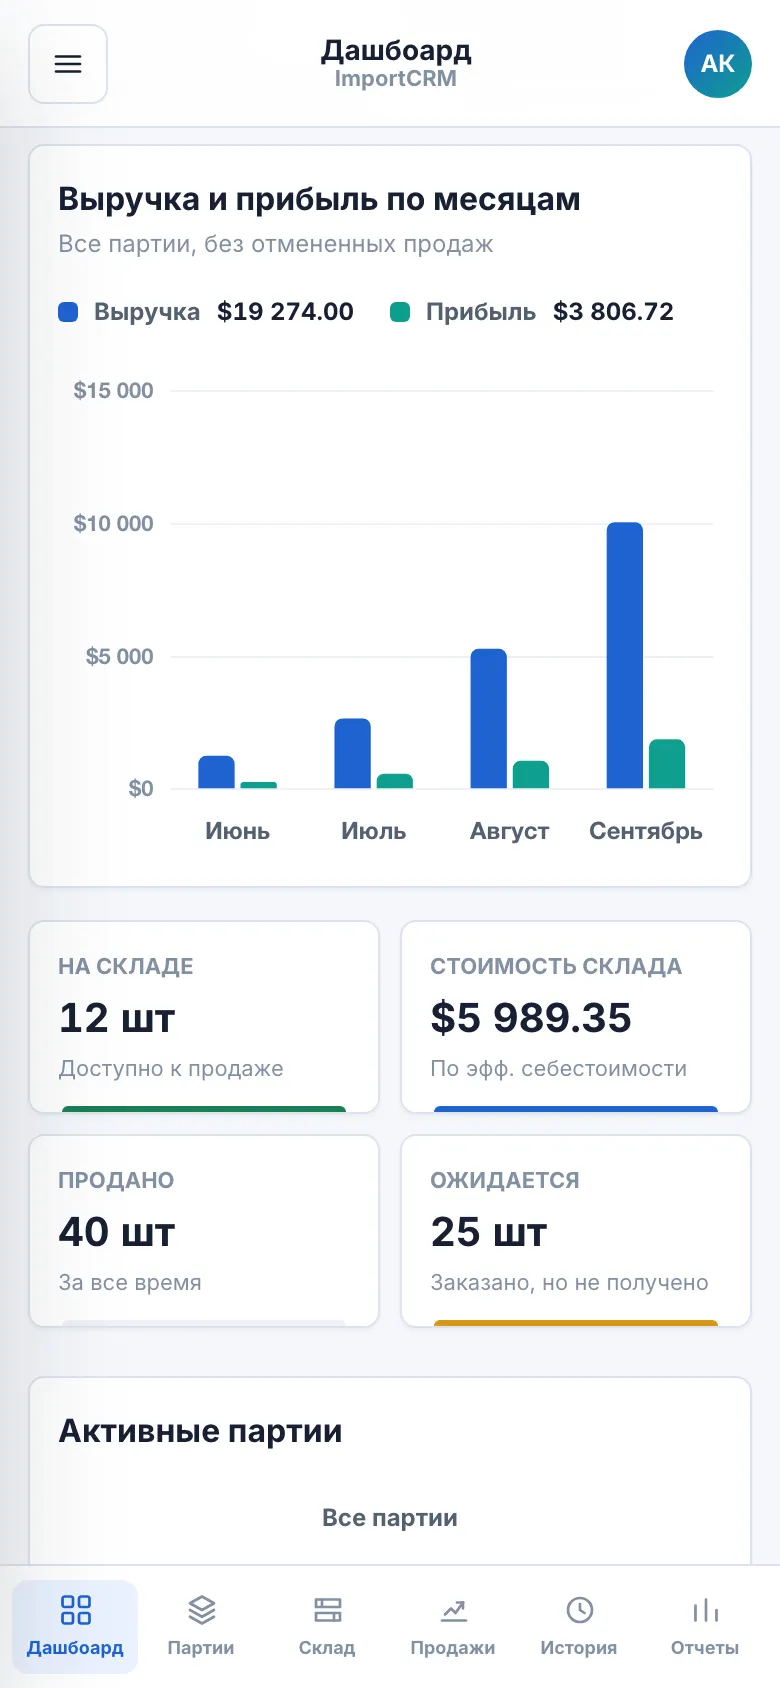
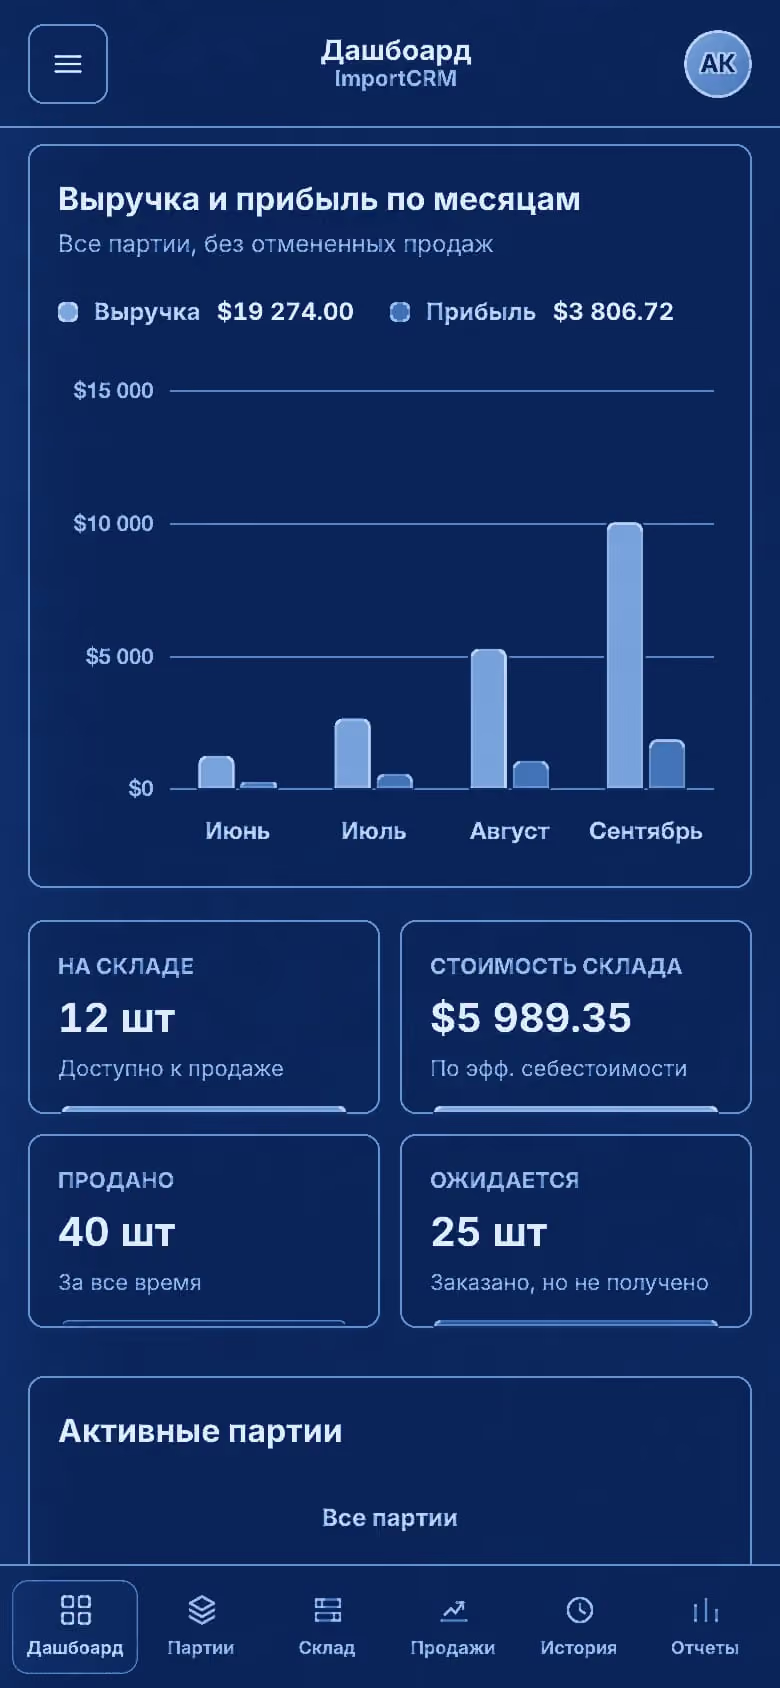
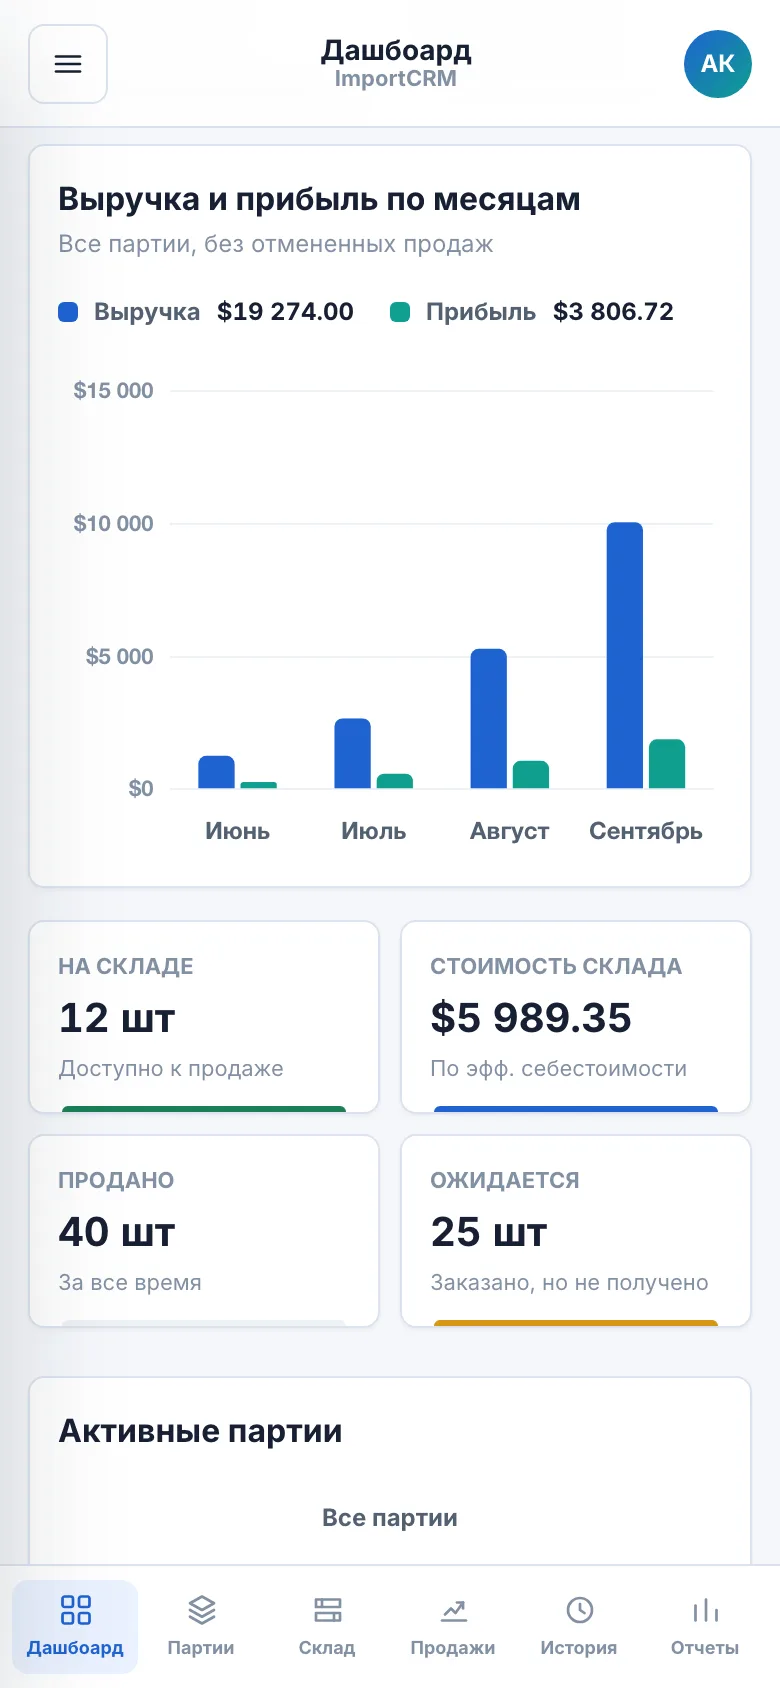
- Dashboard with invested capital, revenue, profit and ROI, a monthly revenue-vs-profit chart and stock KPIs
- Period reports by product category and sales platform
- Audit log filterable by action and section
Key decisions
-
Why the batch is the unit of accounting
Costs arrive per shipment, not per product. Spreading batch expenses evenly across the units actually received turns a messy shipment into a clean, predictable unit cost that is easy to audit.
-
Why each sale snapshots its cost
Profit and margin are frozen at the moment of sale, so a later expense or cashback updates stock costs without rewriting yesterday’s results.
-
Why every change keeps its old and new value
Three partners with equal rights need accountability rather than permissions: the audit log records who changed what, in which record, and from which value to which.
-
Why one Express app runs in two places
The API is split from its server entry point, so the same code runs as a long-lived process in development and as a single Vercel function in production.
Elevations — the desktop screens.
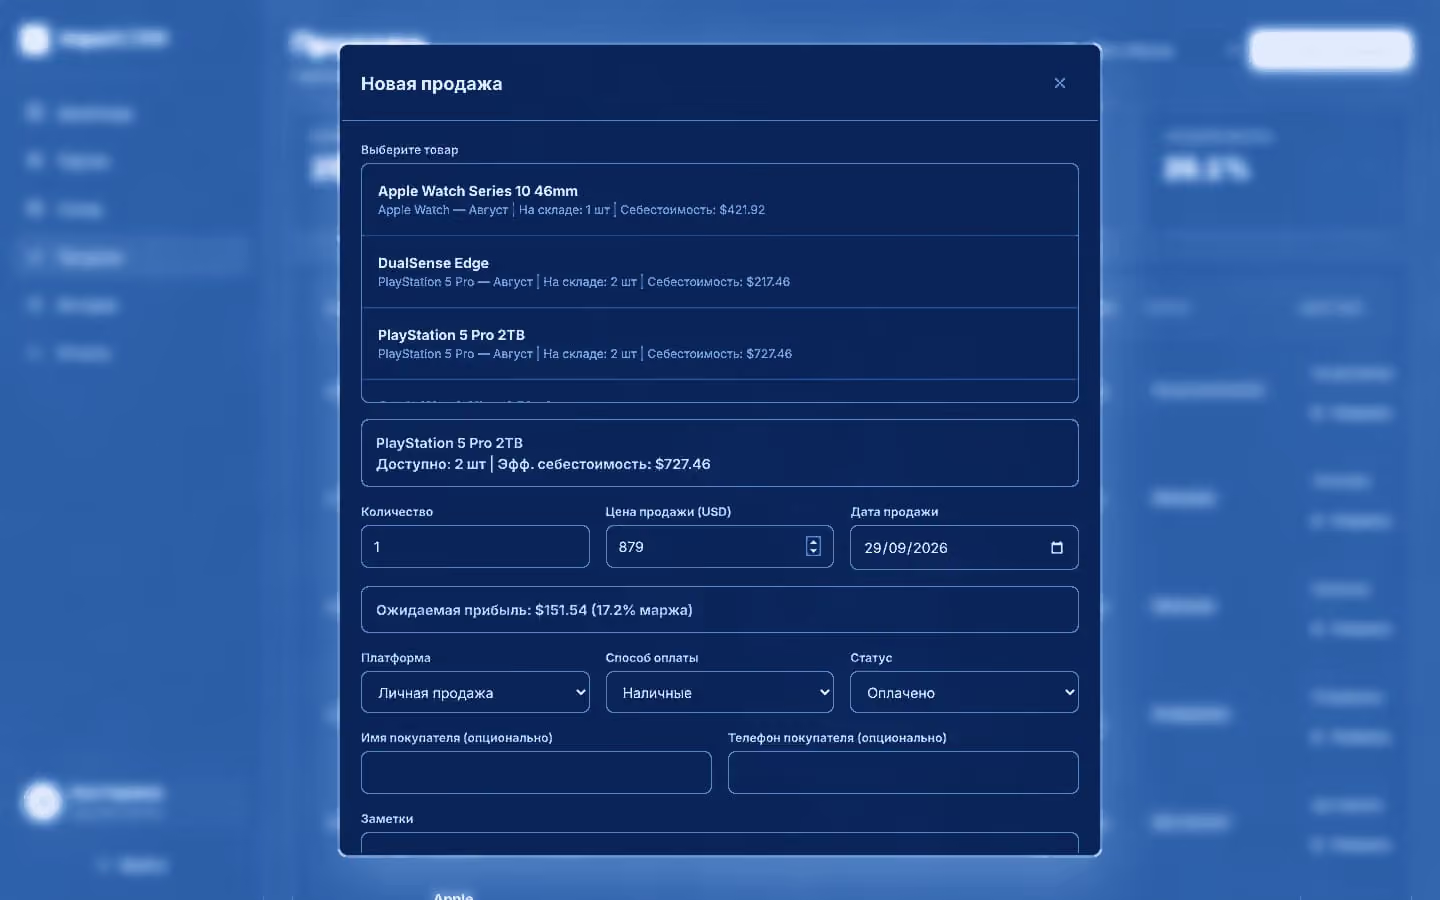
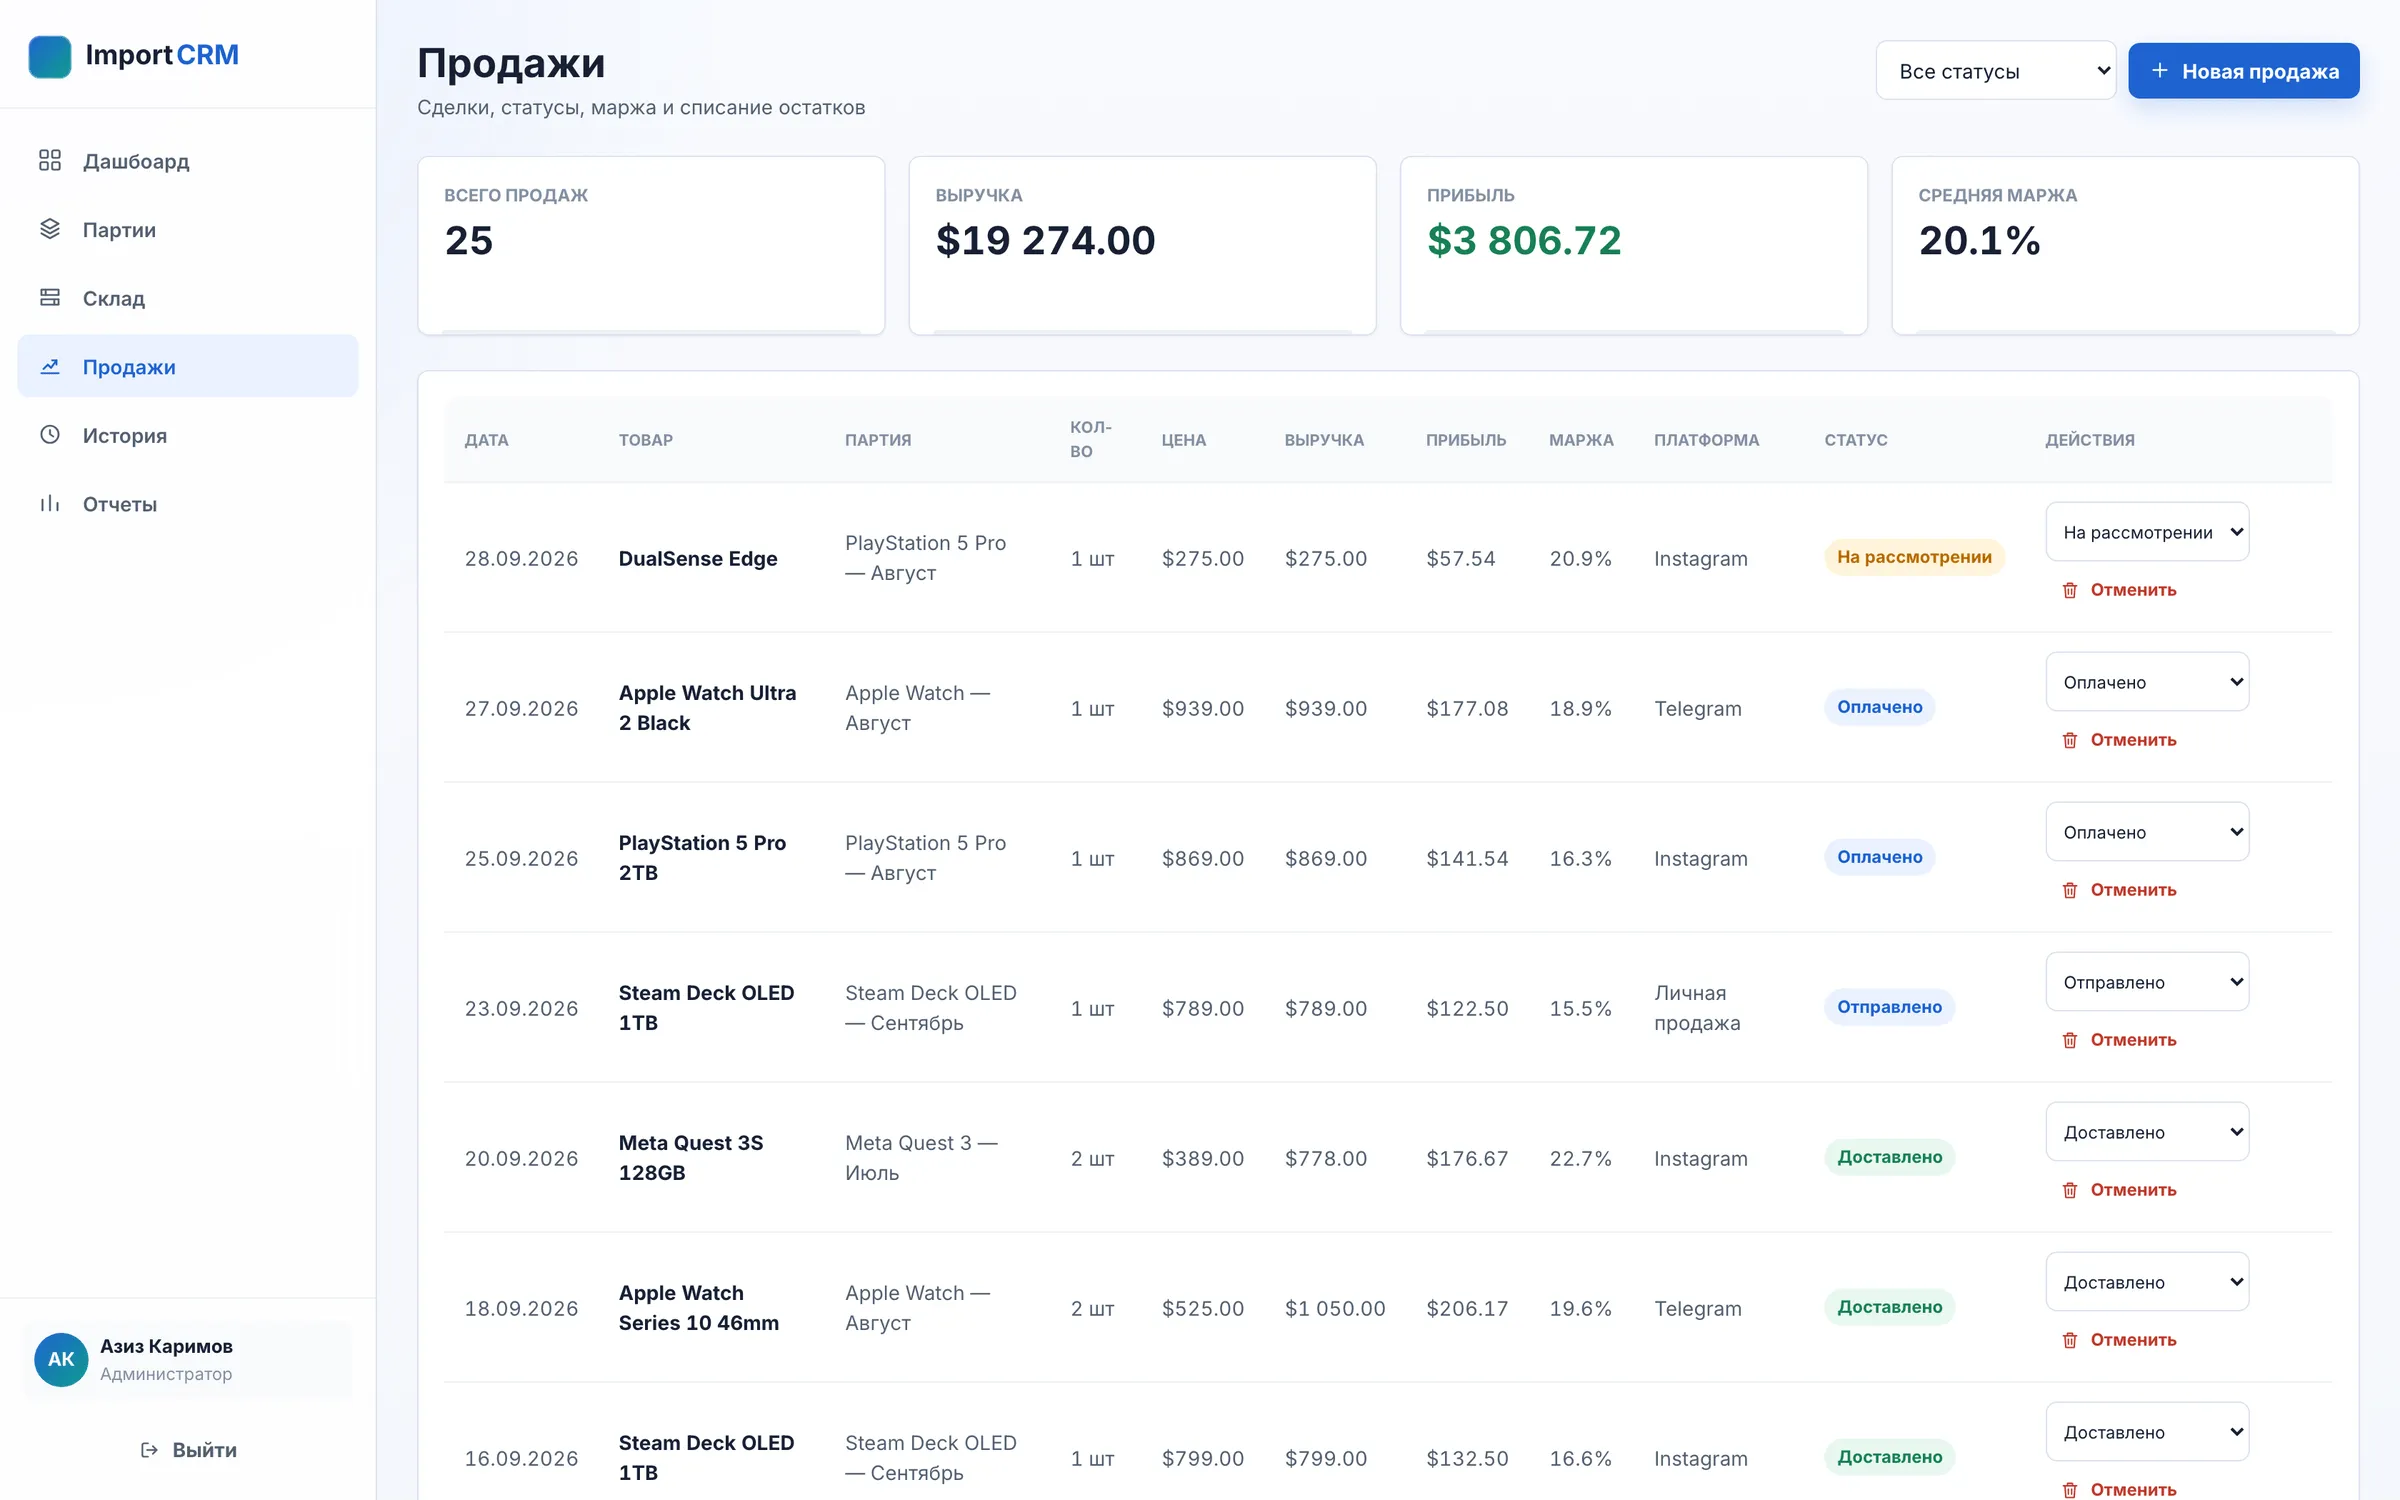
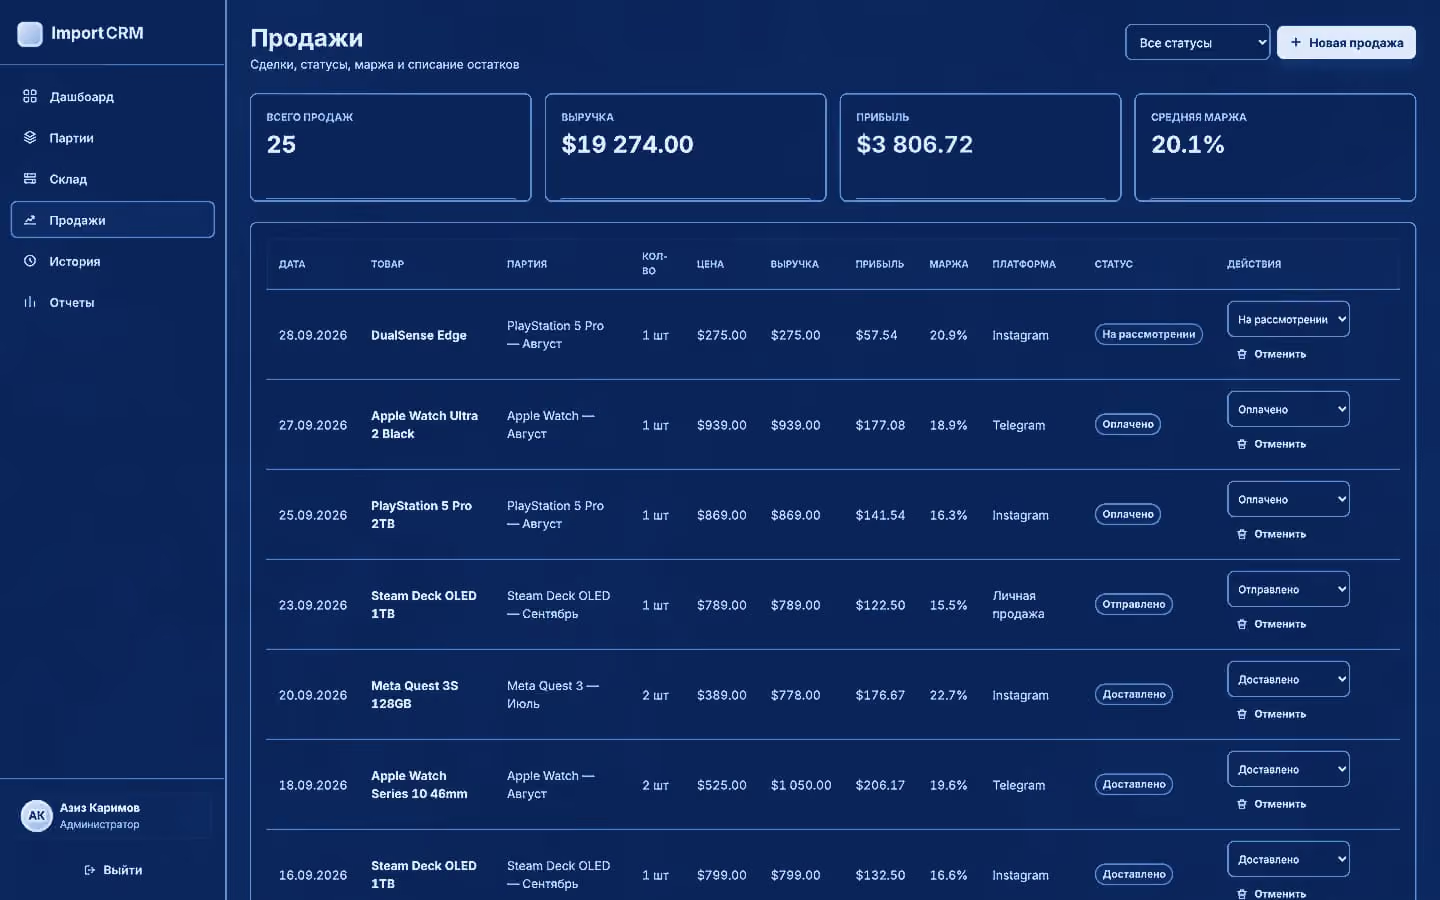
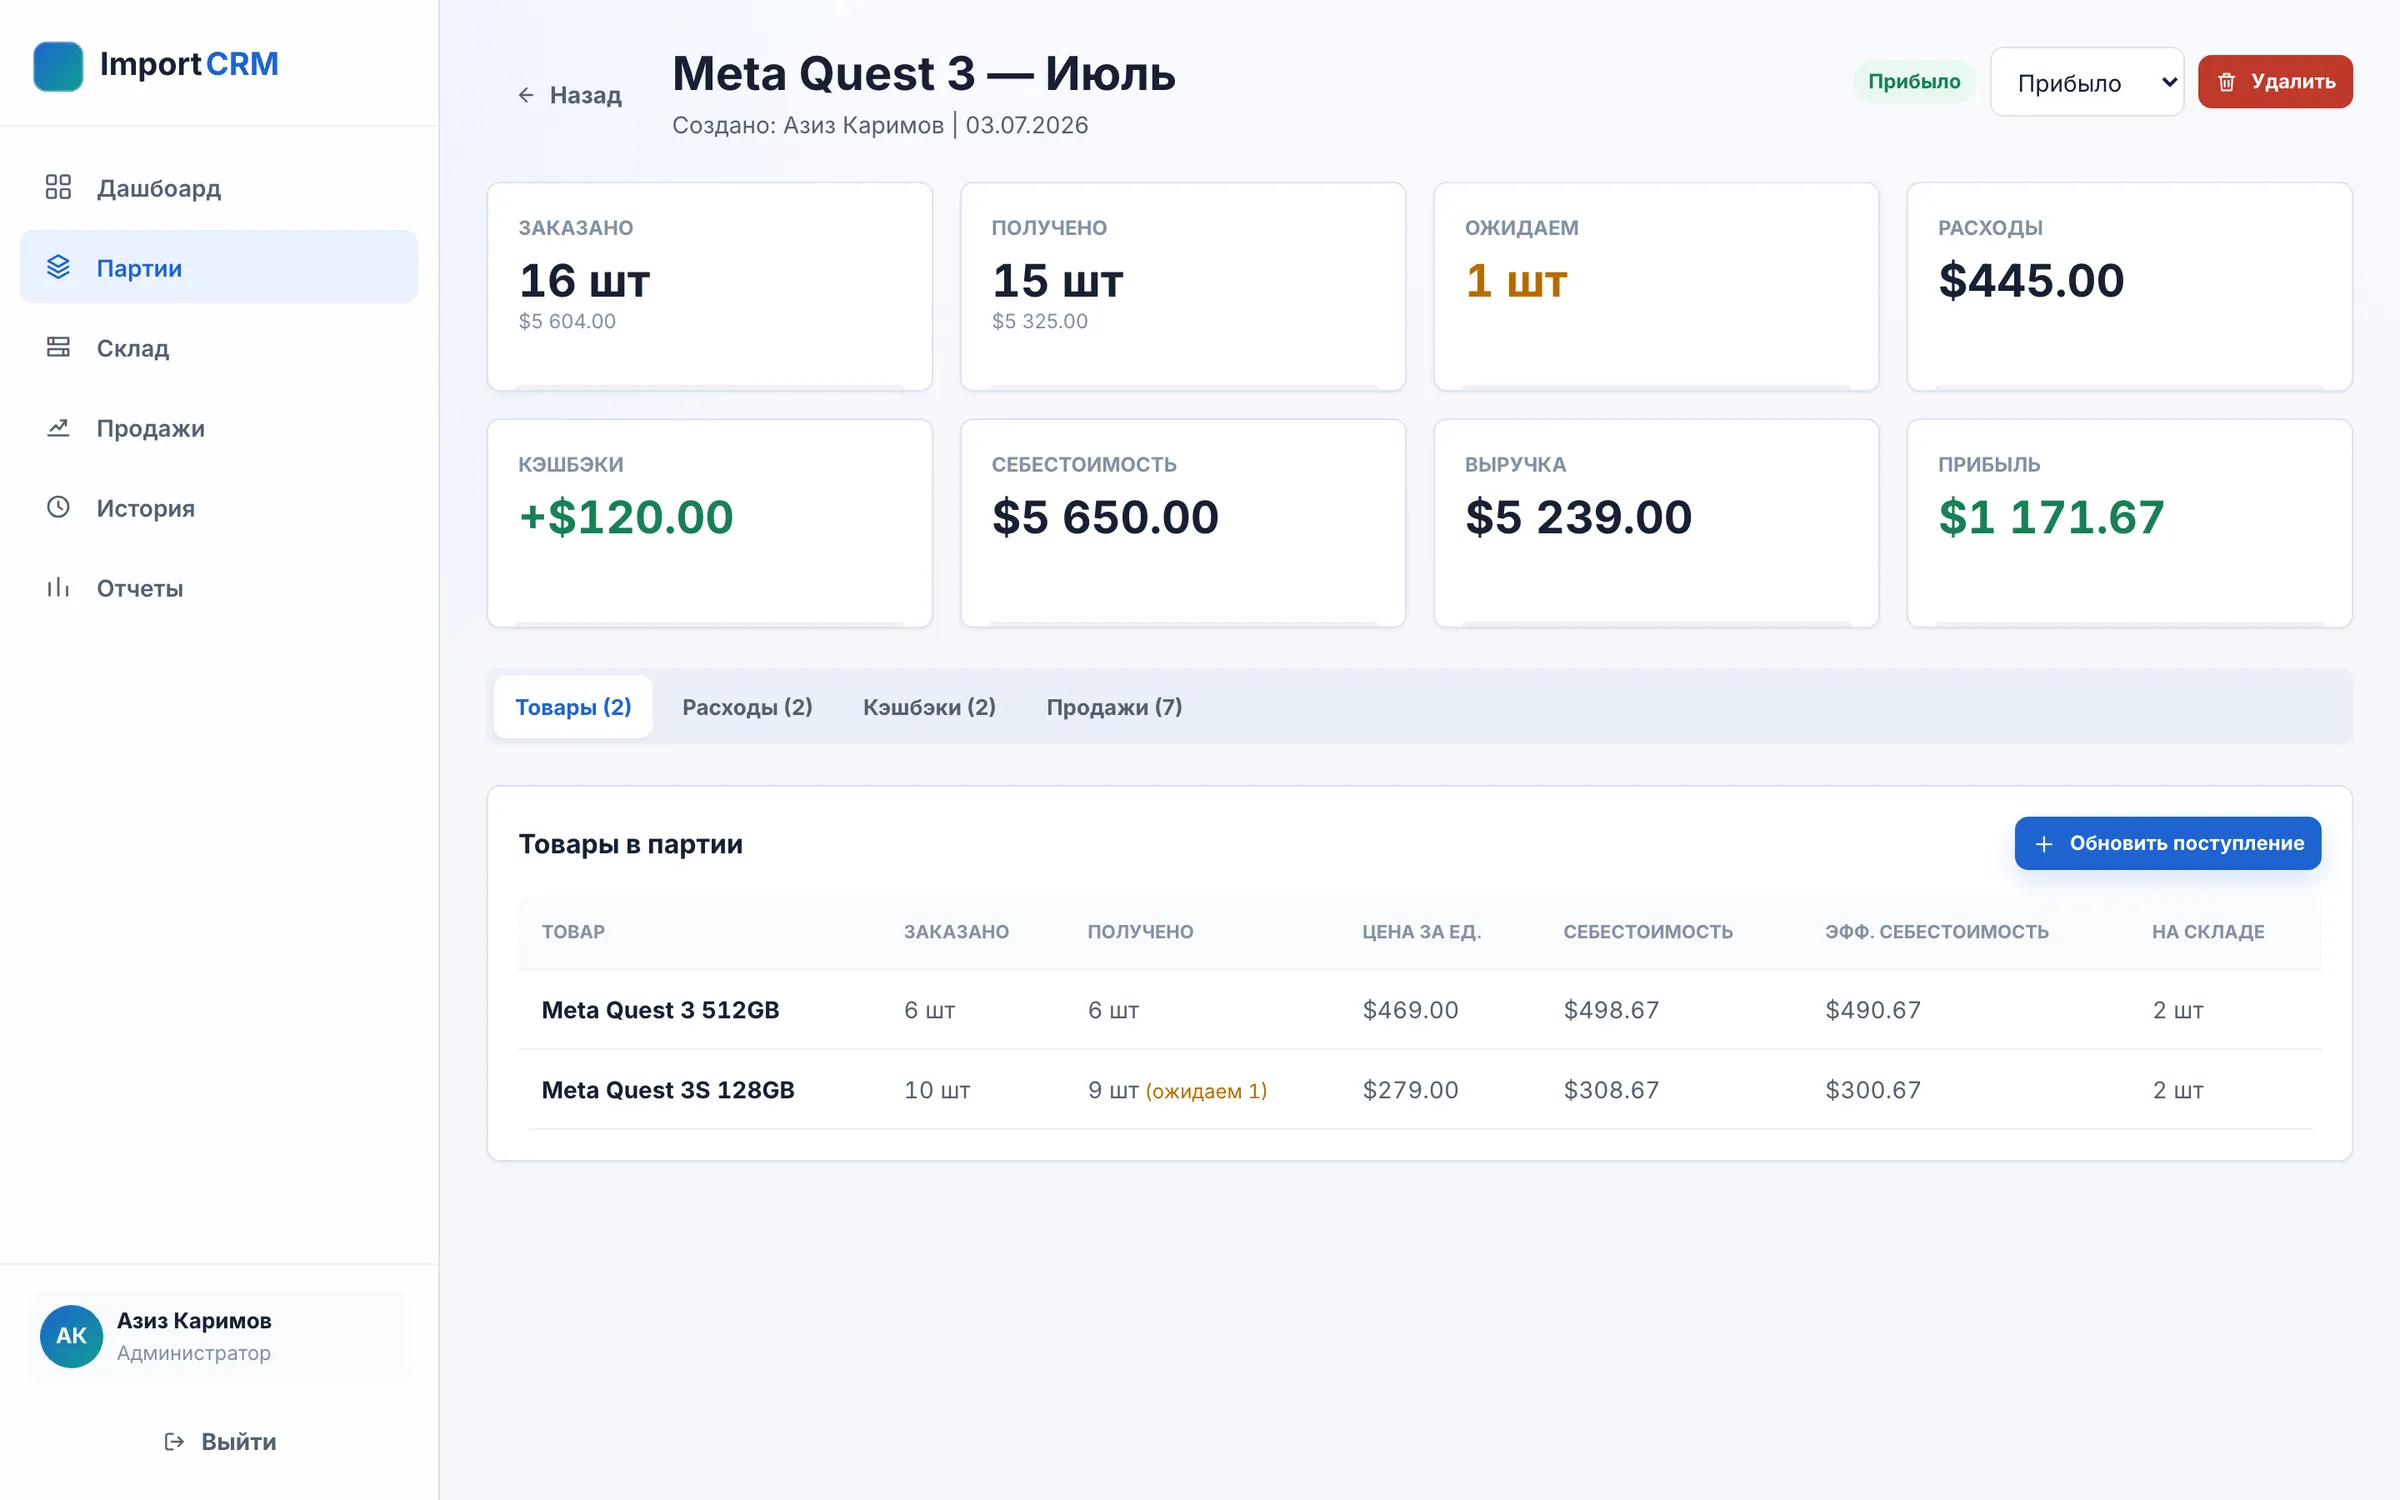


All elevations 05
-
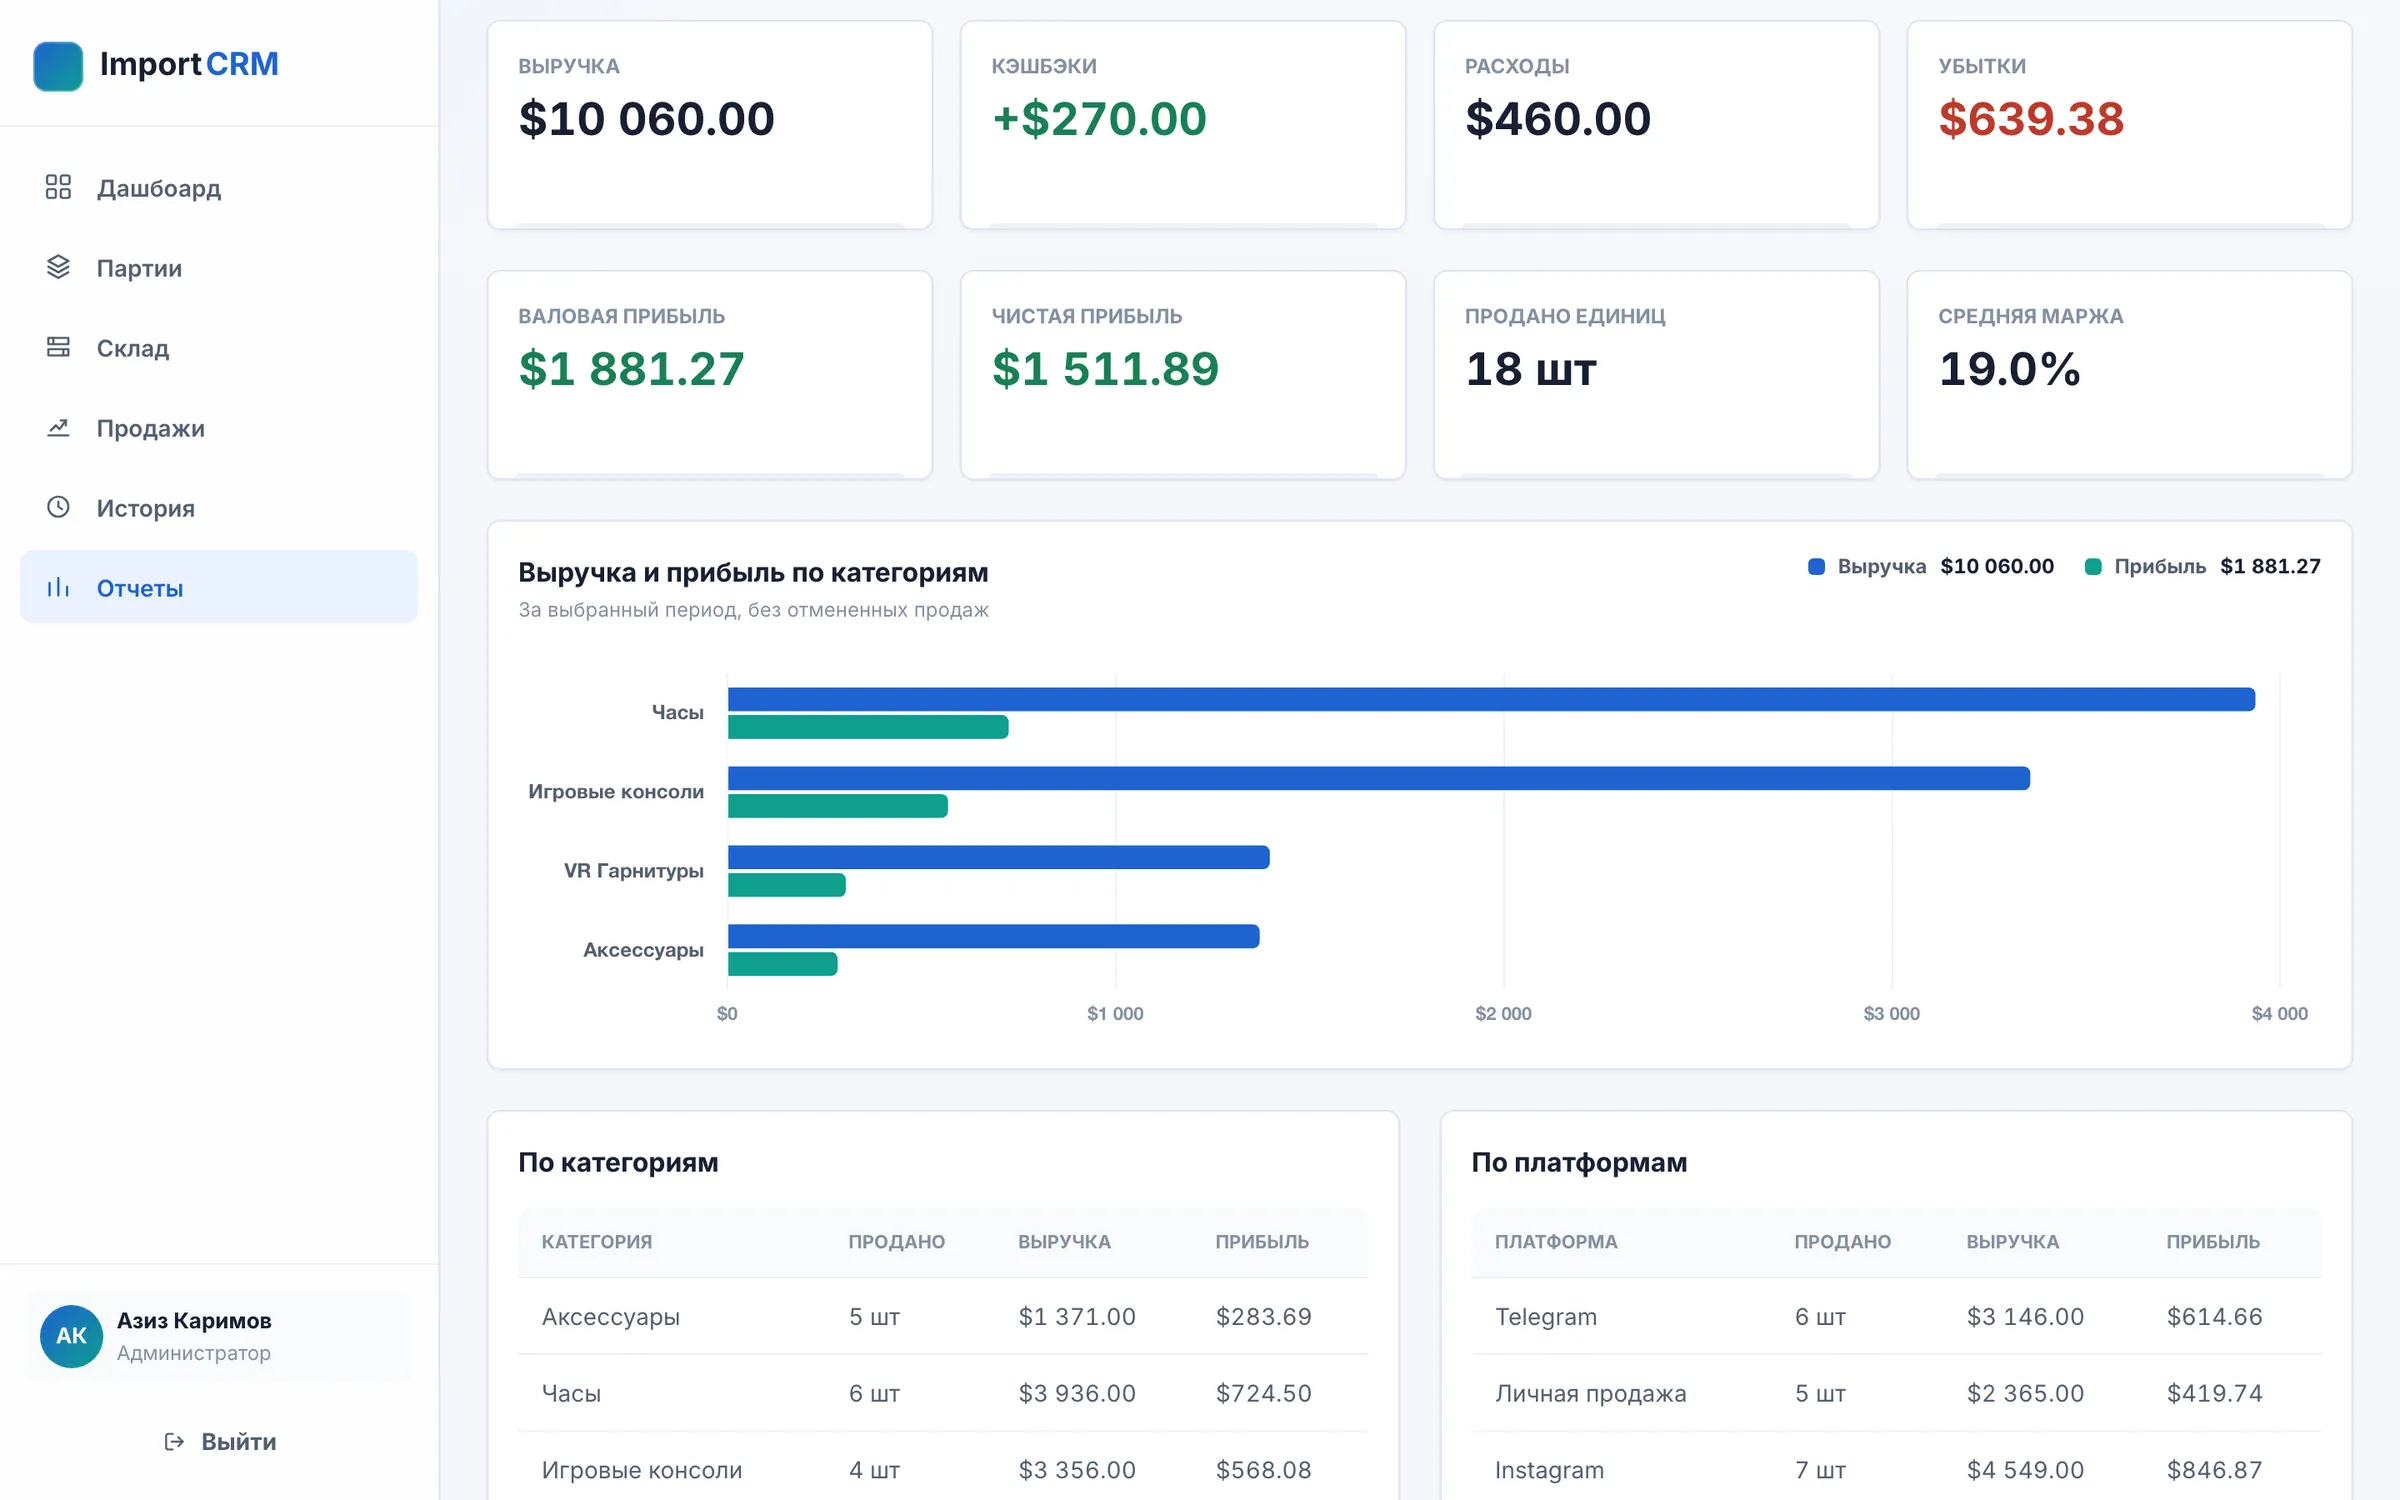
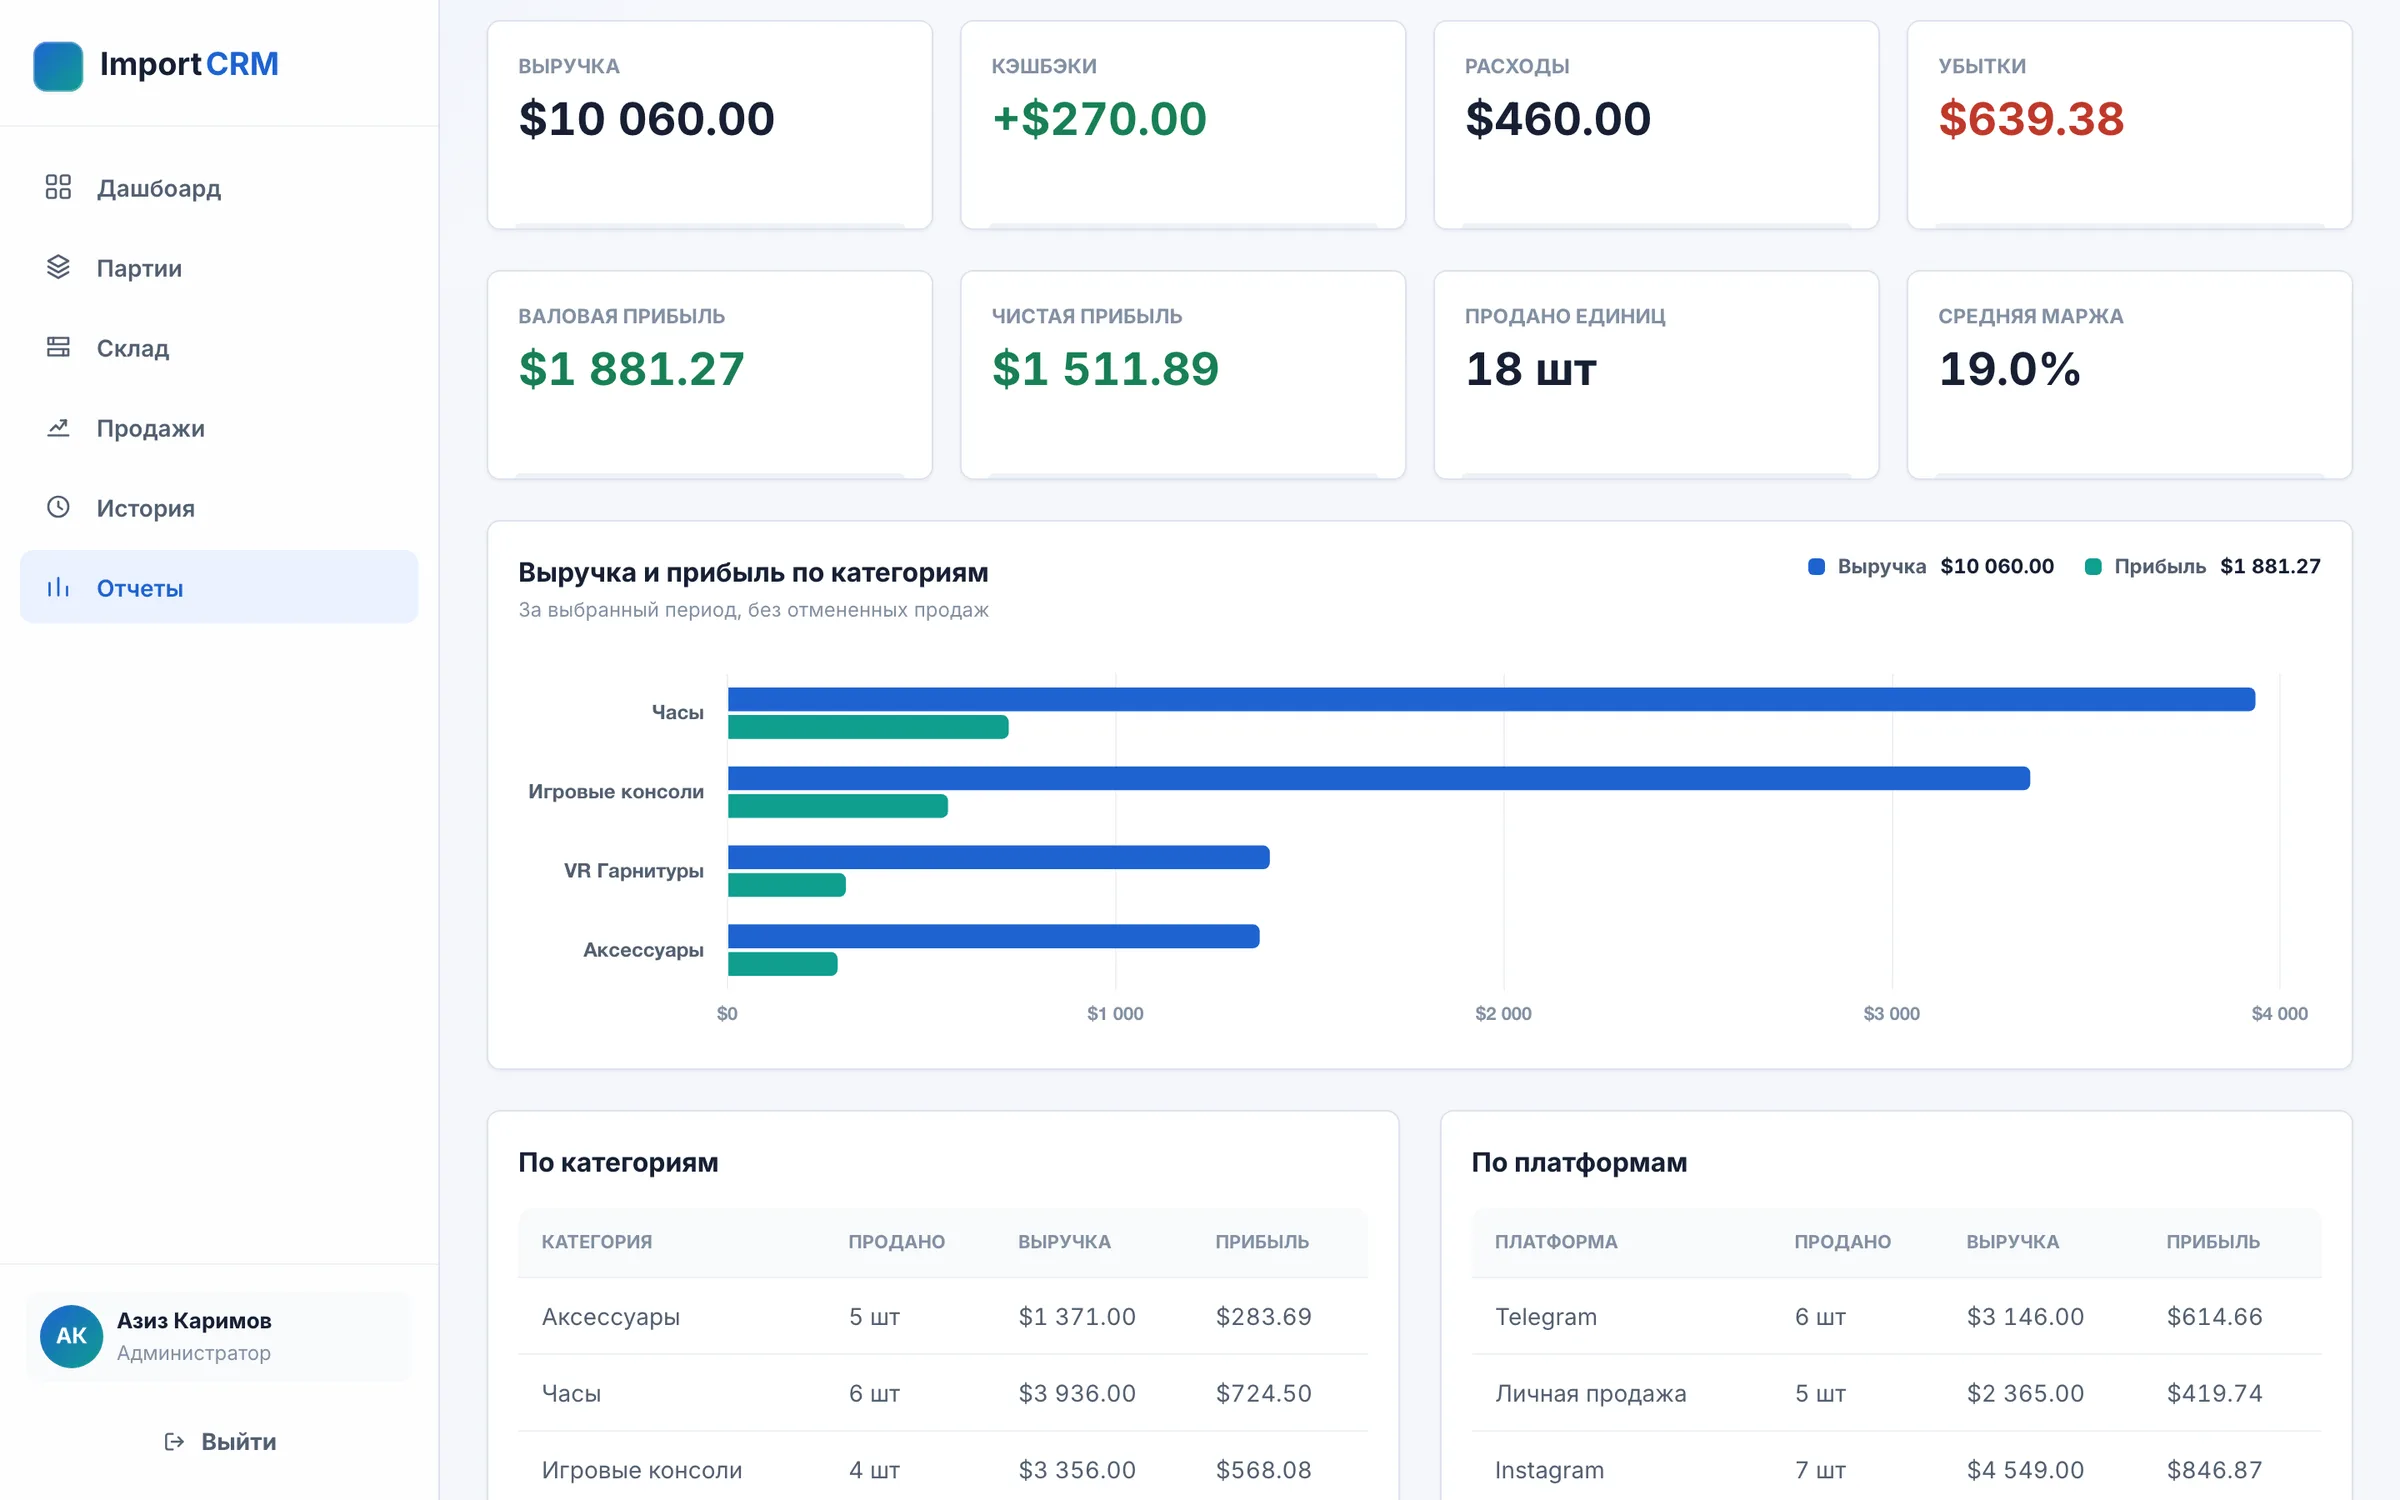
Fig. 4.1 September period report: revenue, cashbacks, expenses, losses, gross and net profit, average margin and revenue versus profit by product category. -
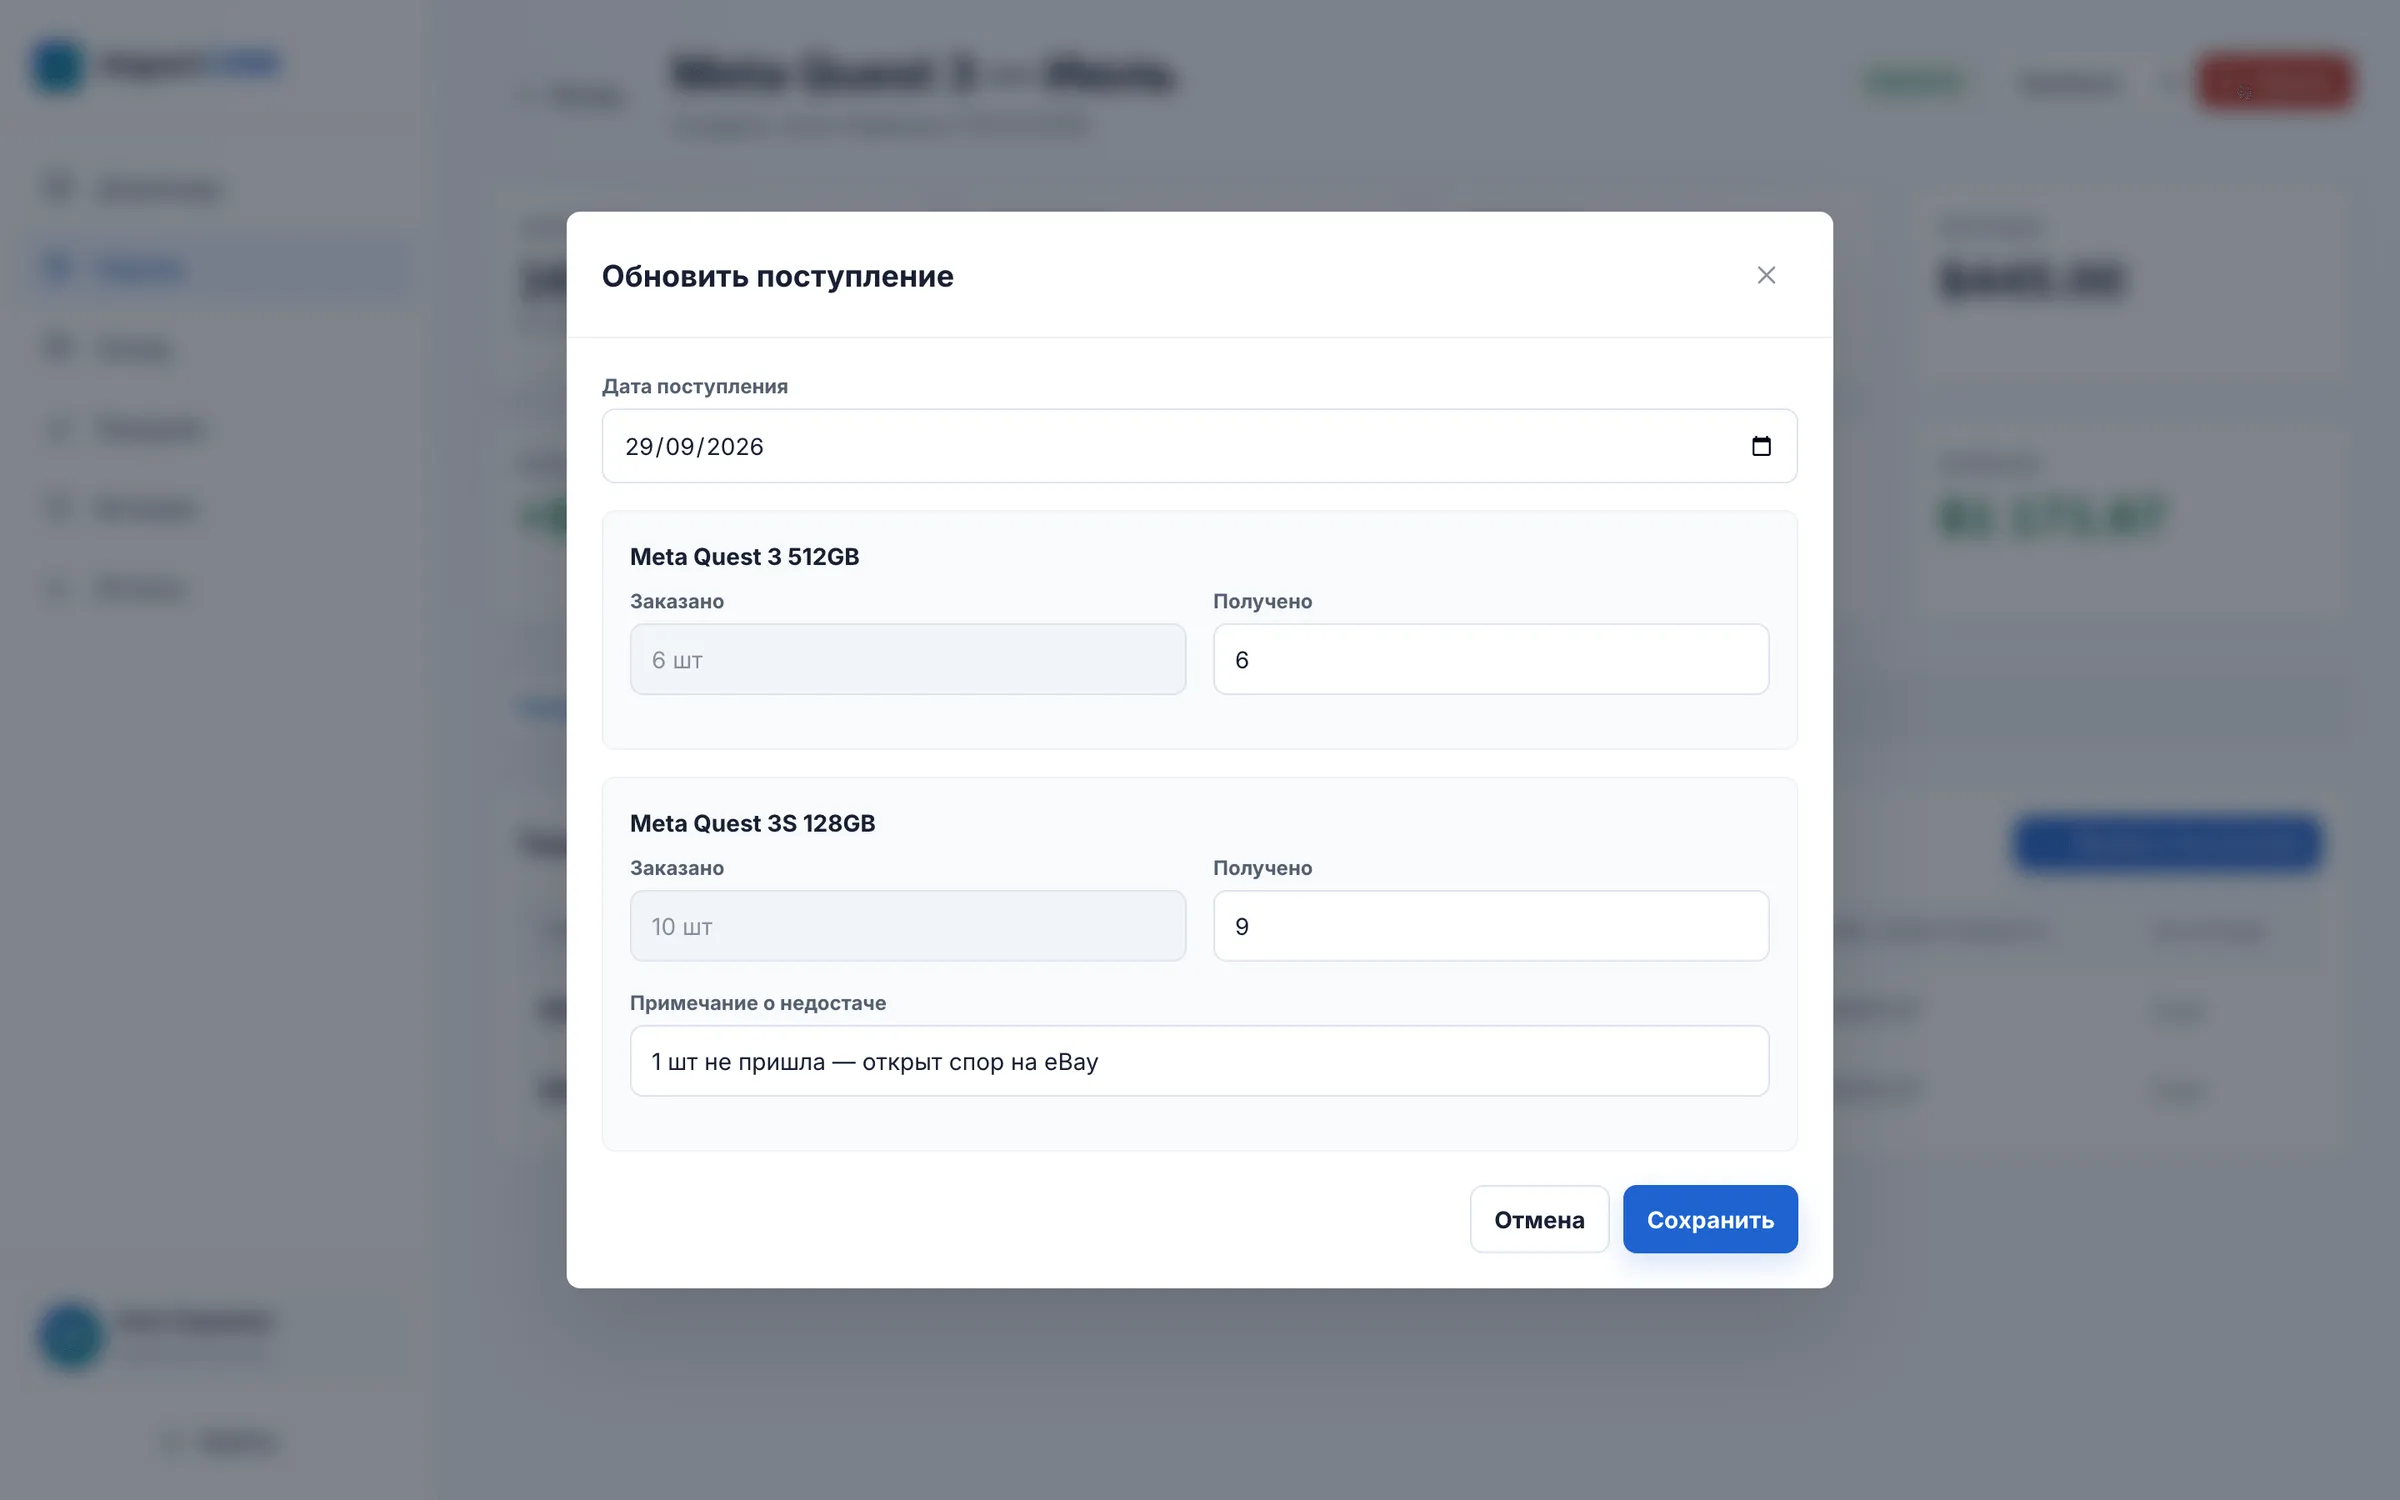
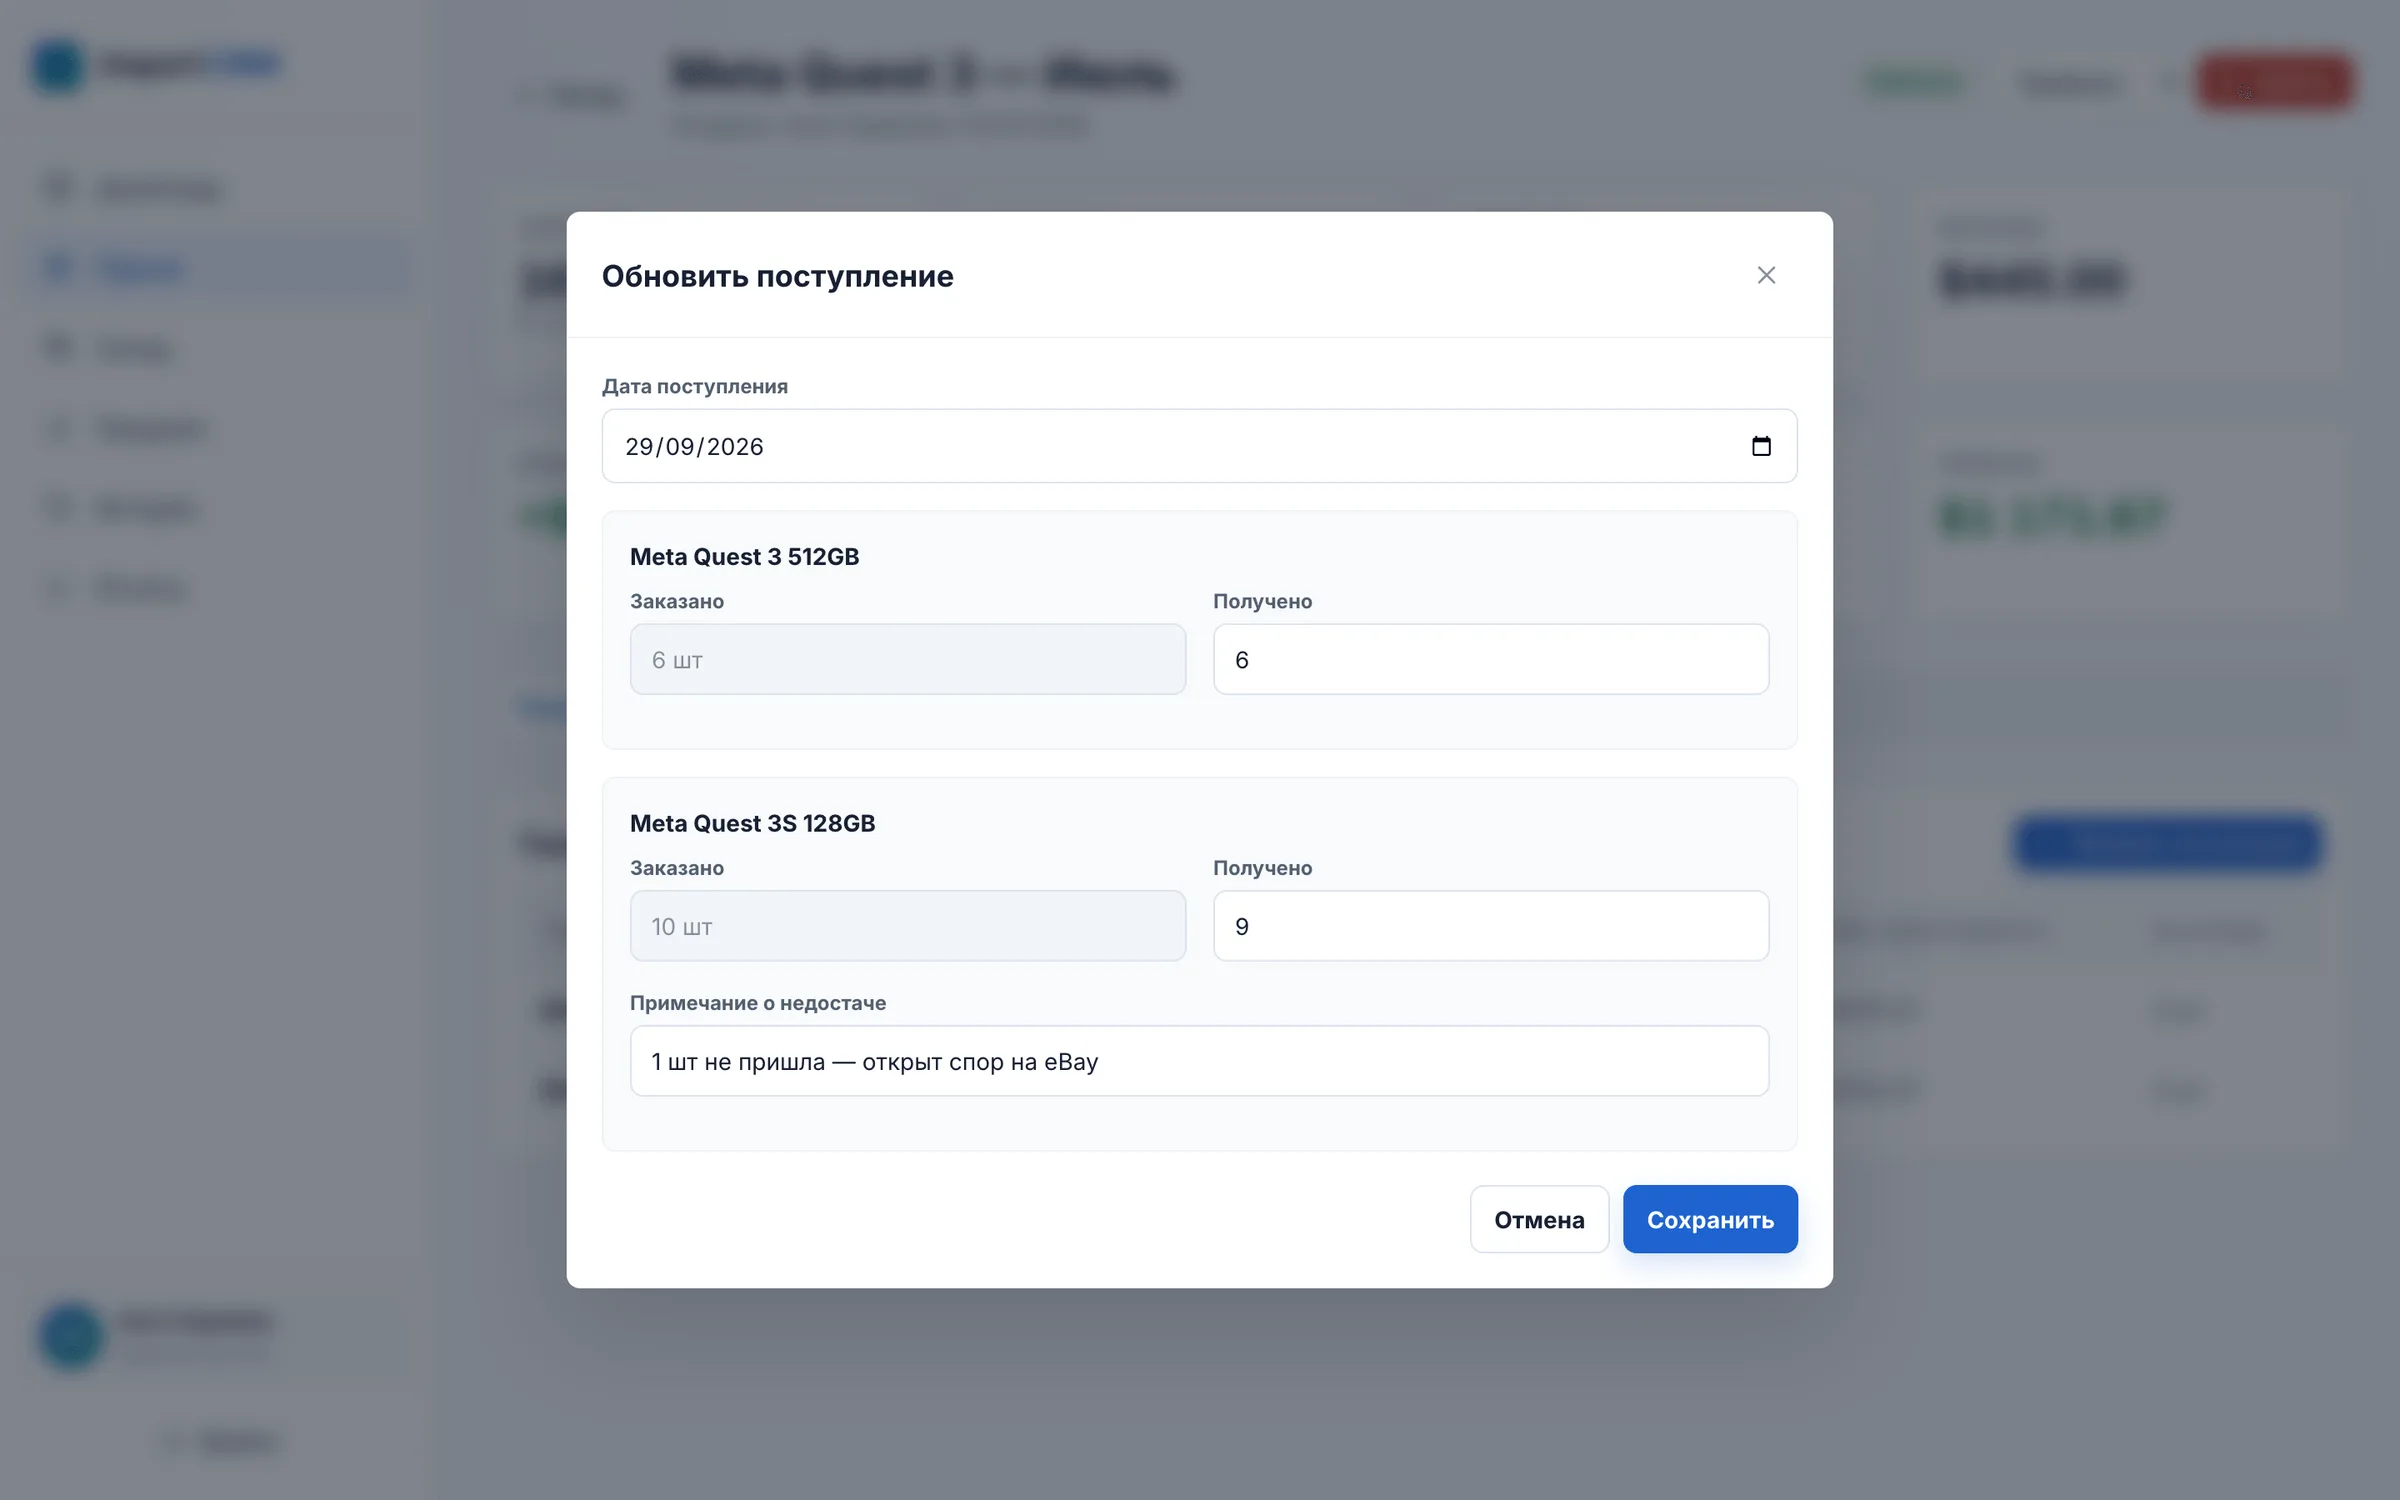
Fig. 4.2 Update-arrival dialog: received quantities entered per product against the order, with a note explaining the shortage. -
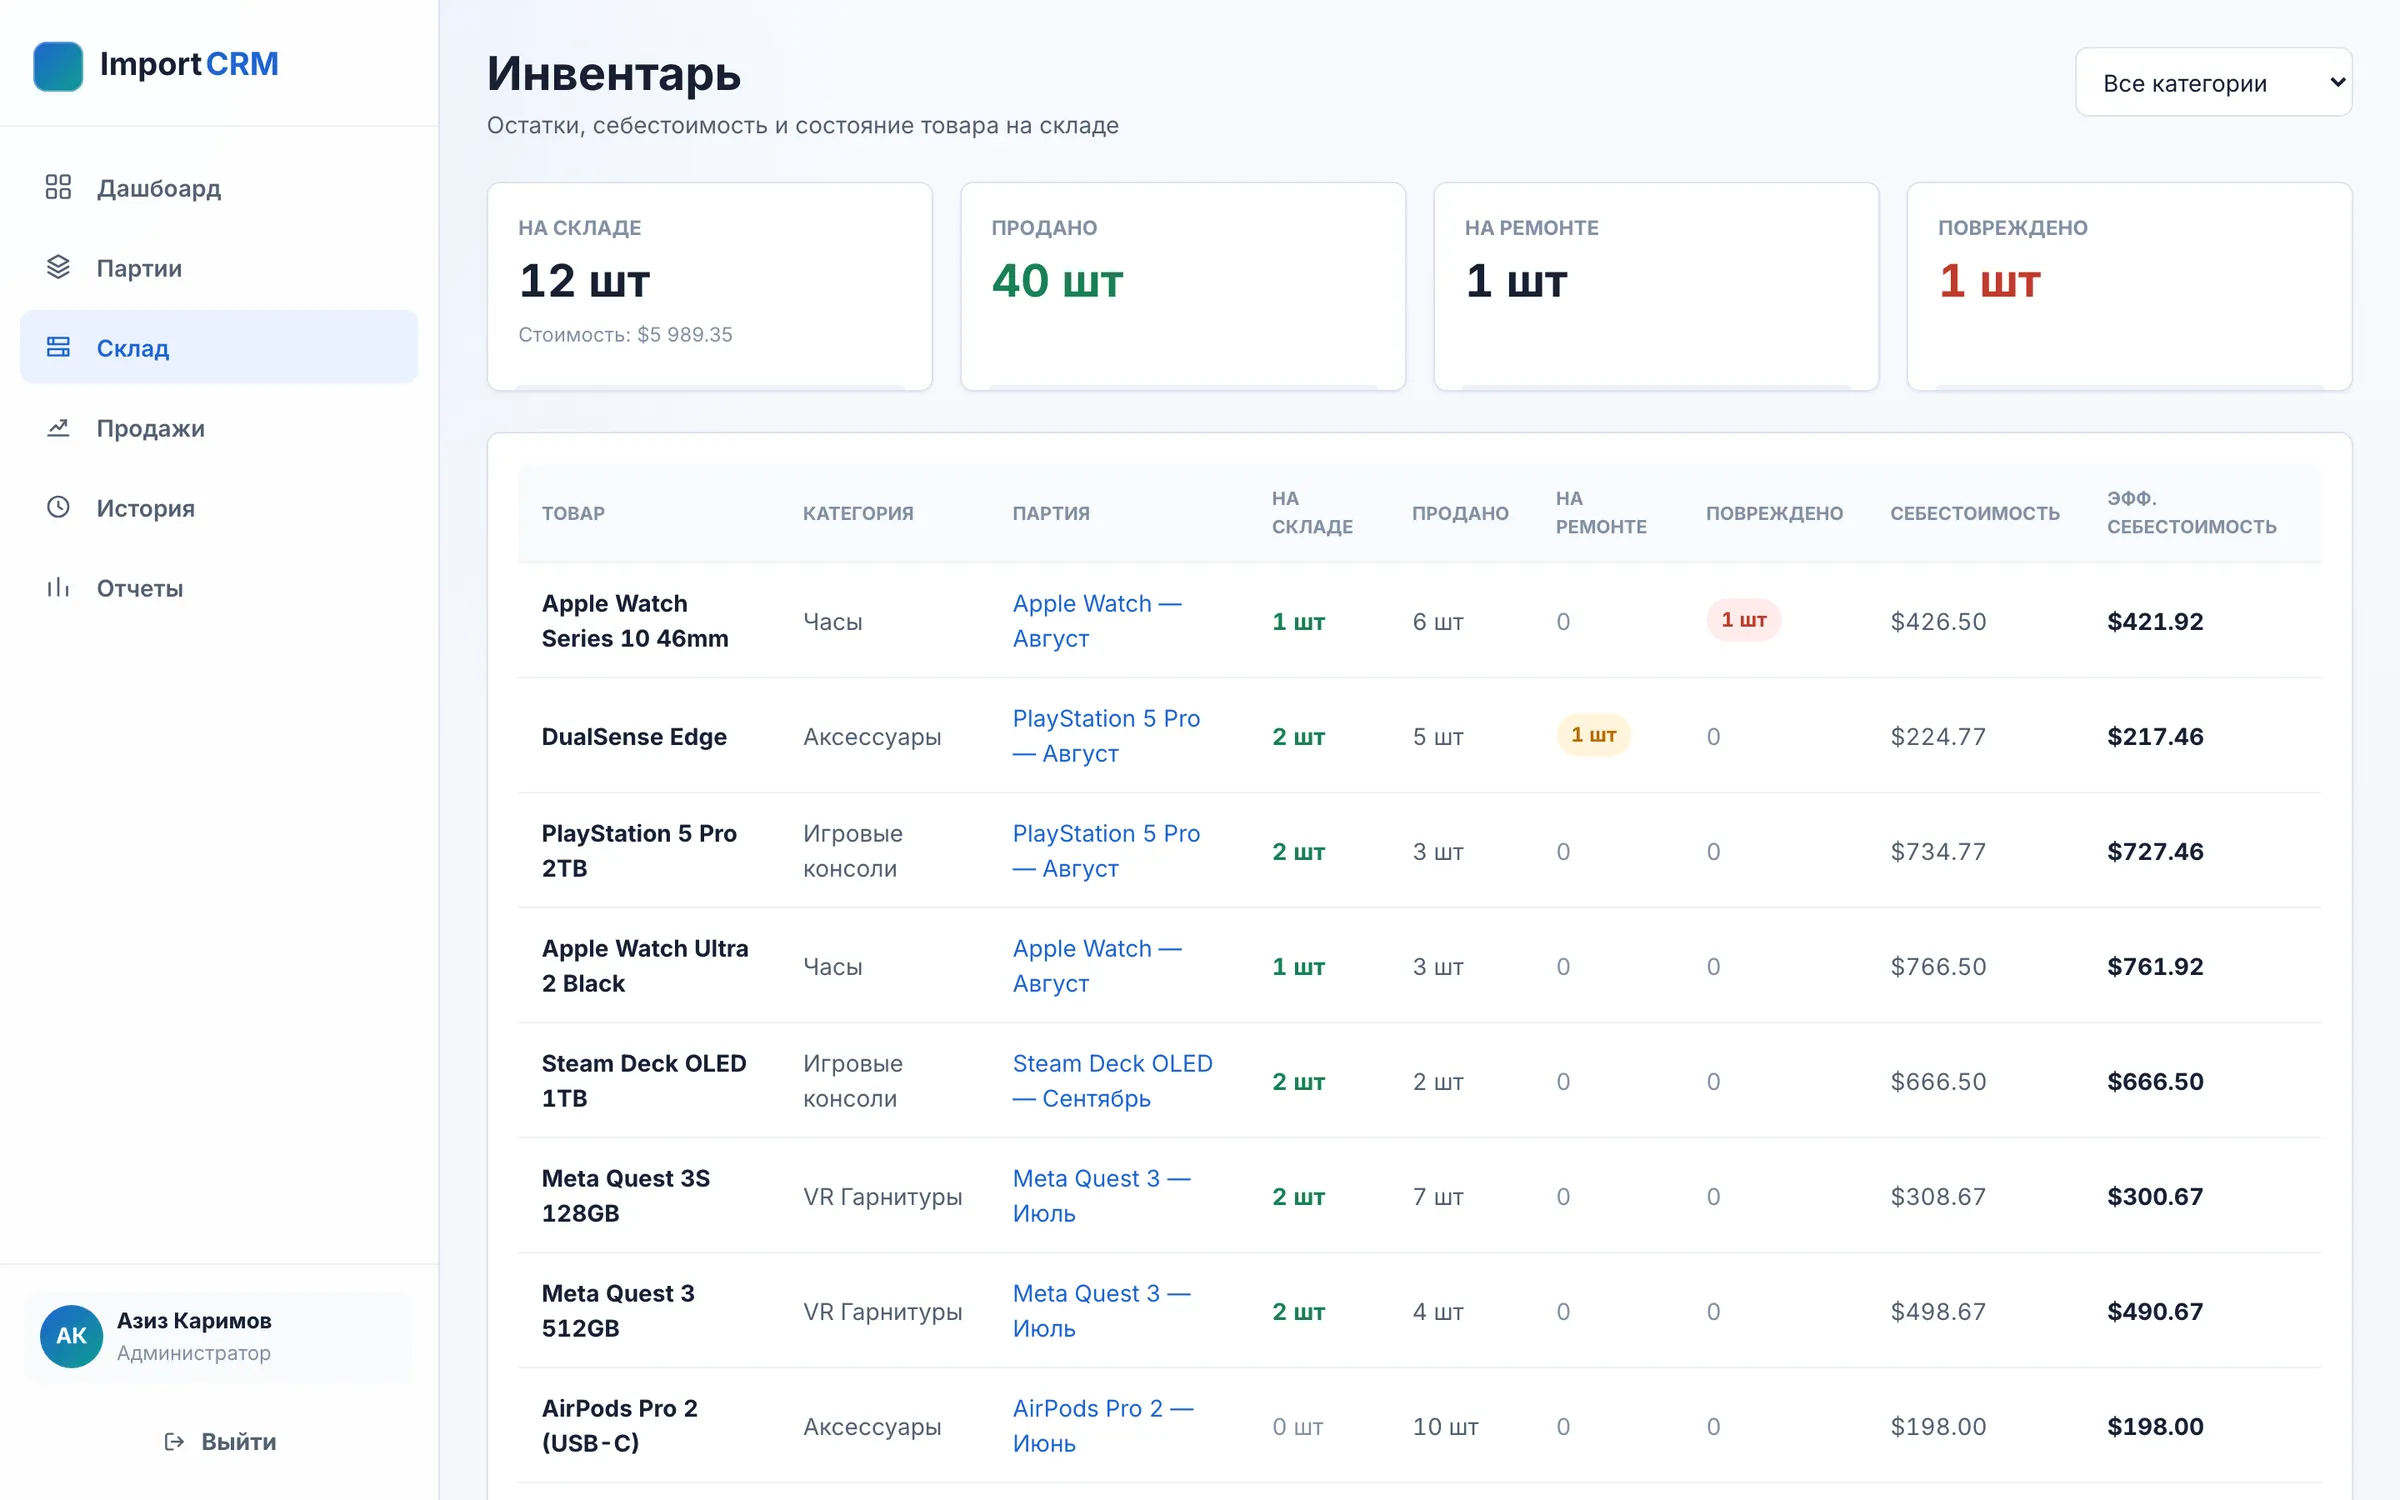
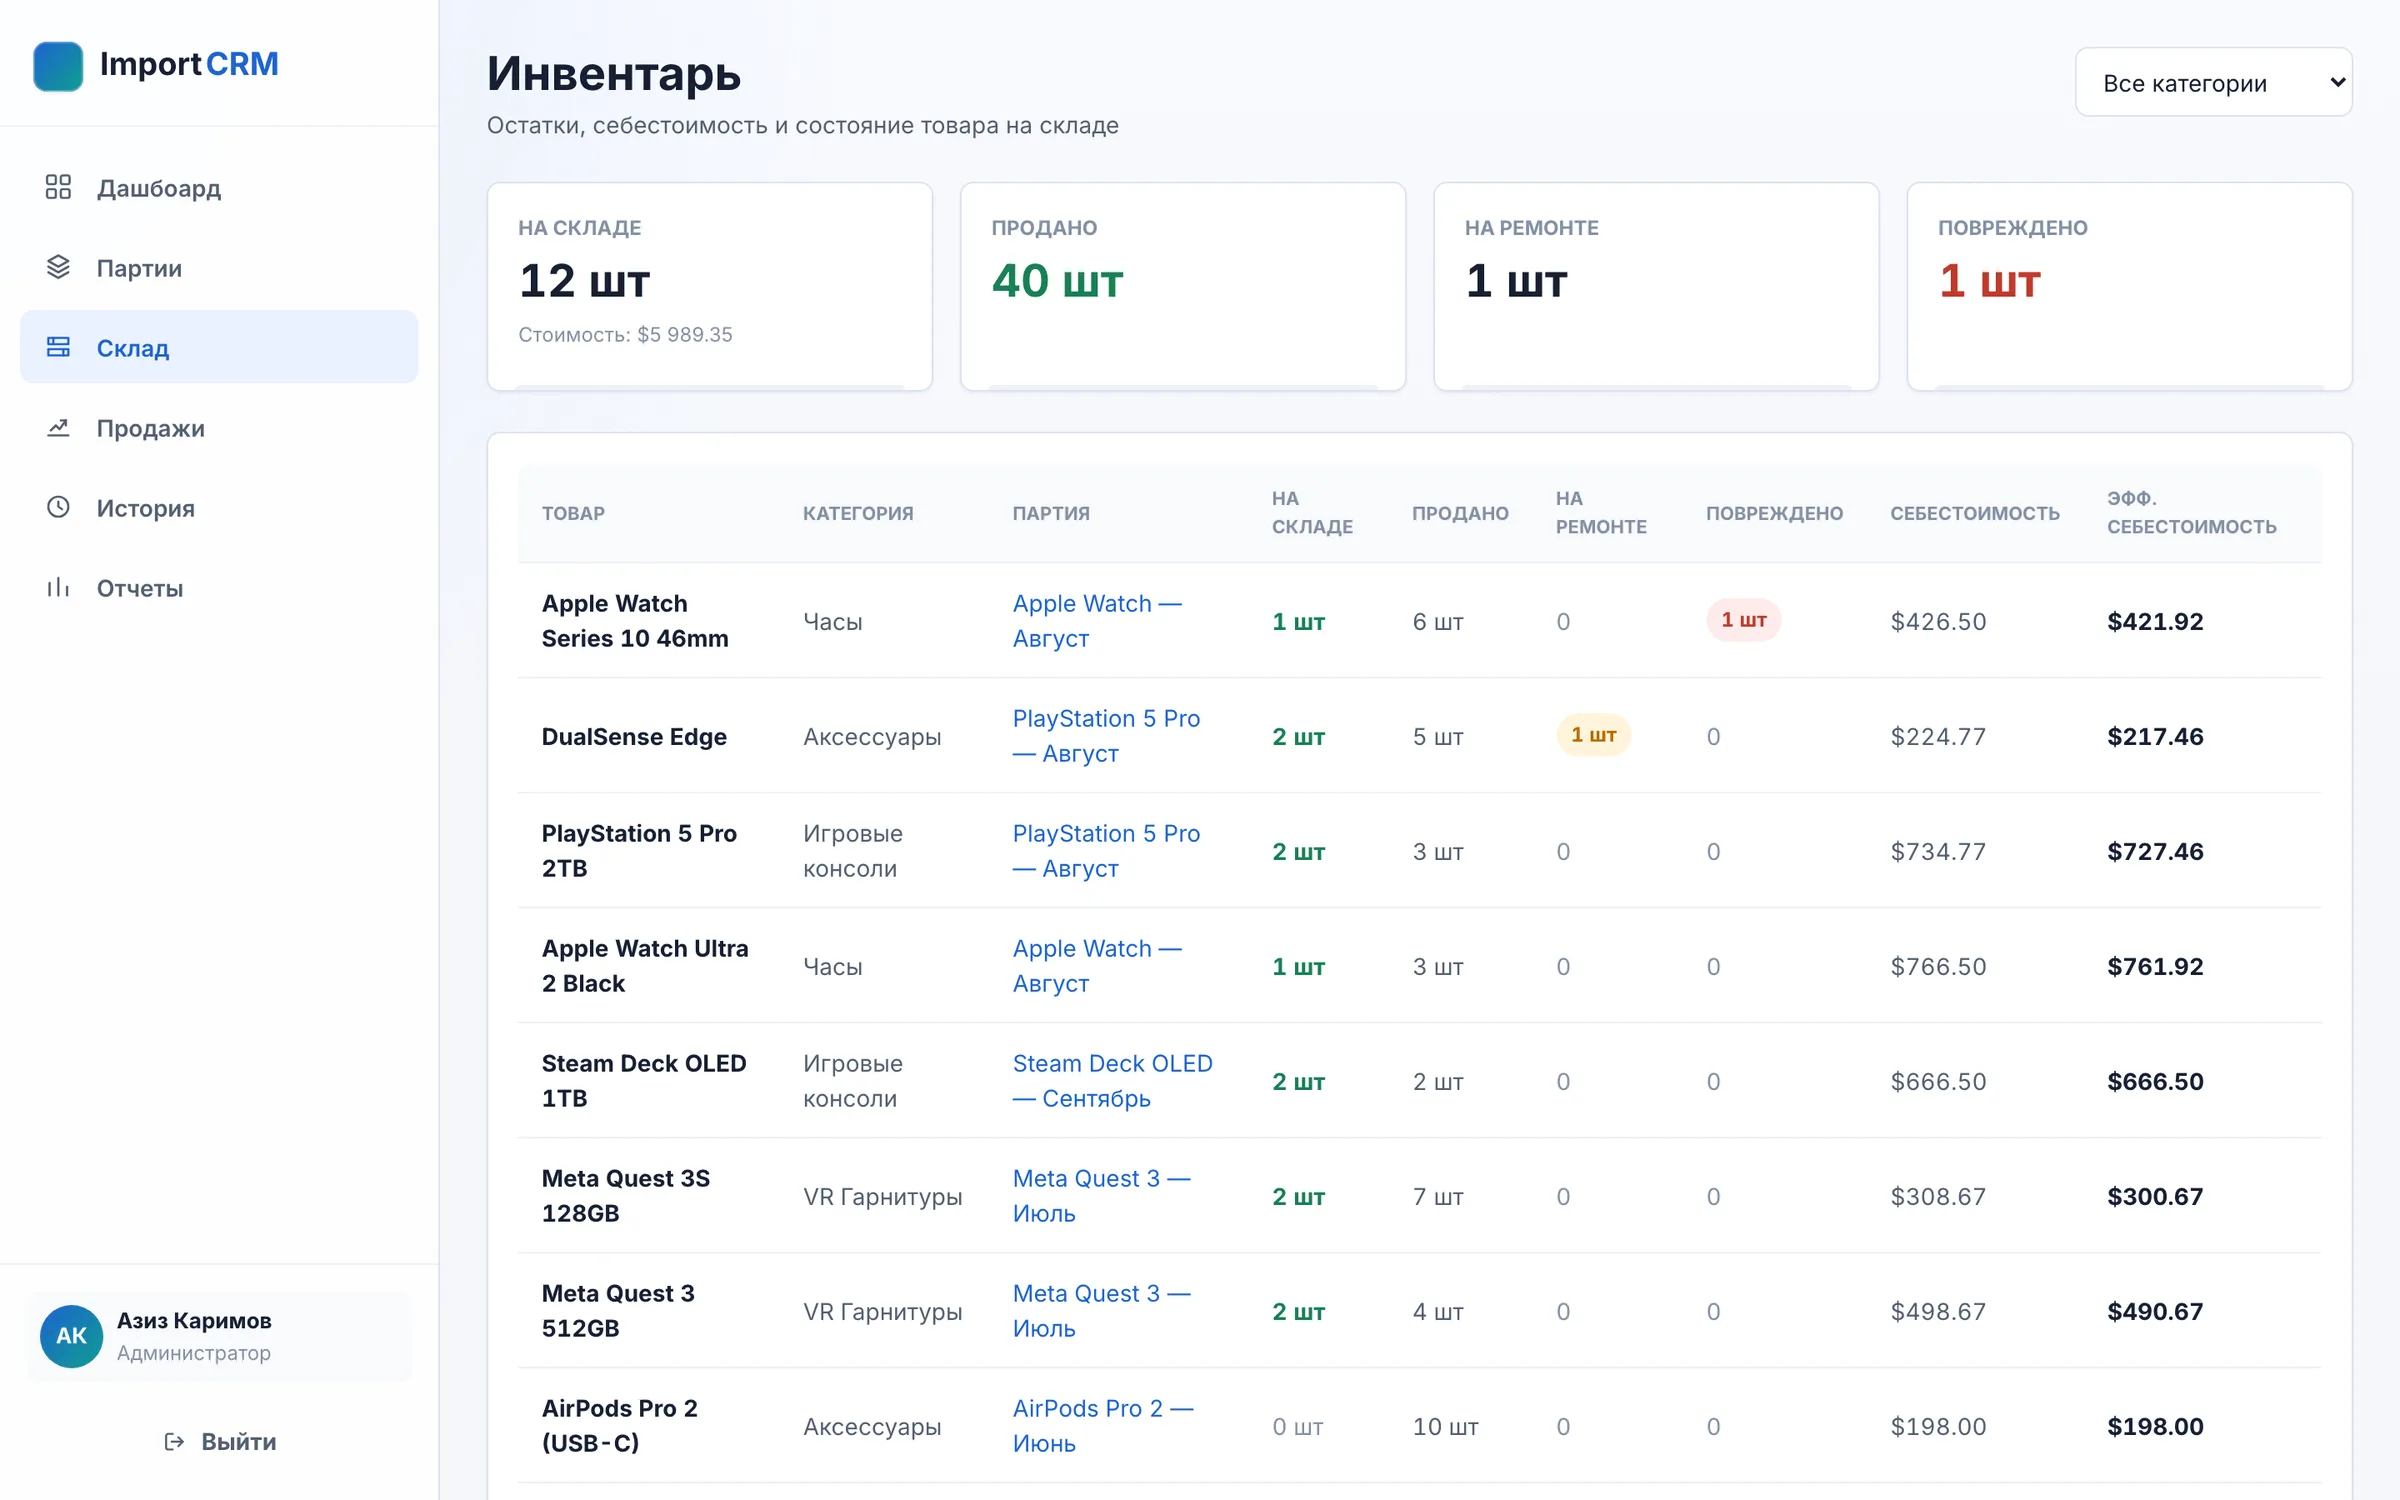
Fig. 4.3 Inventory with in-stock, sold, under-repair and damaged counts and a per-product comparison of base and effective cost. -
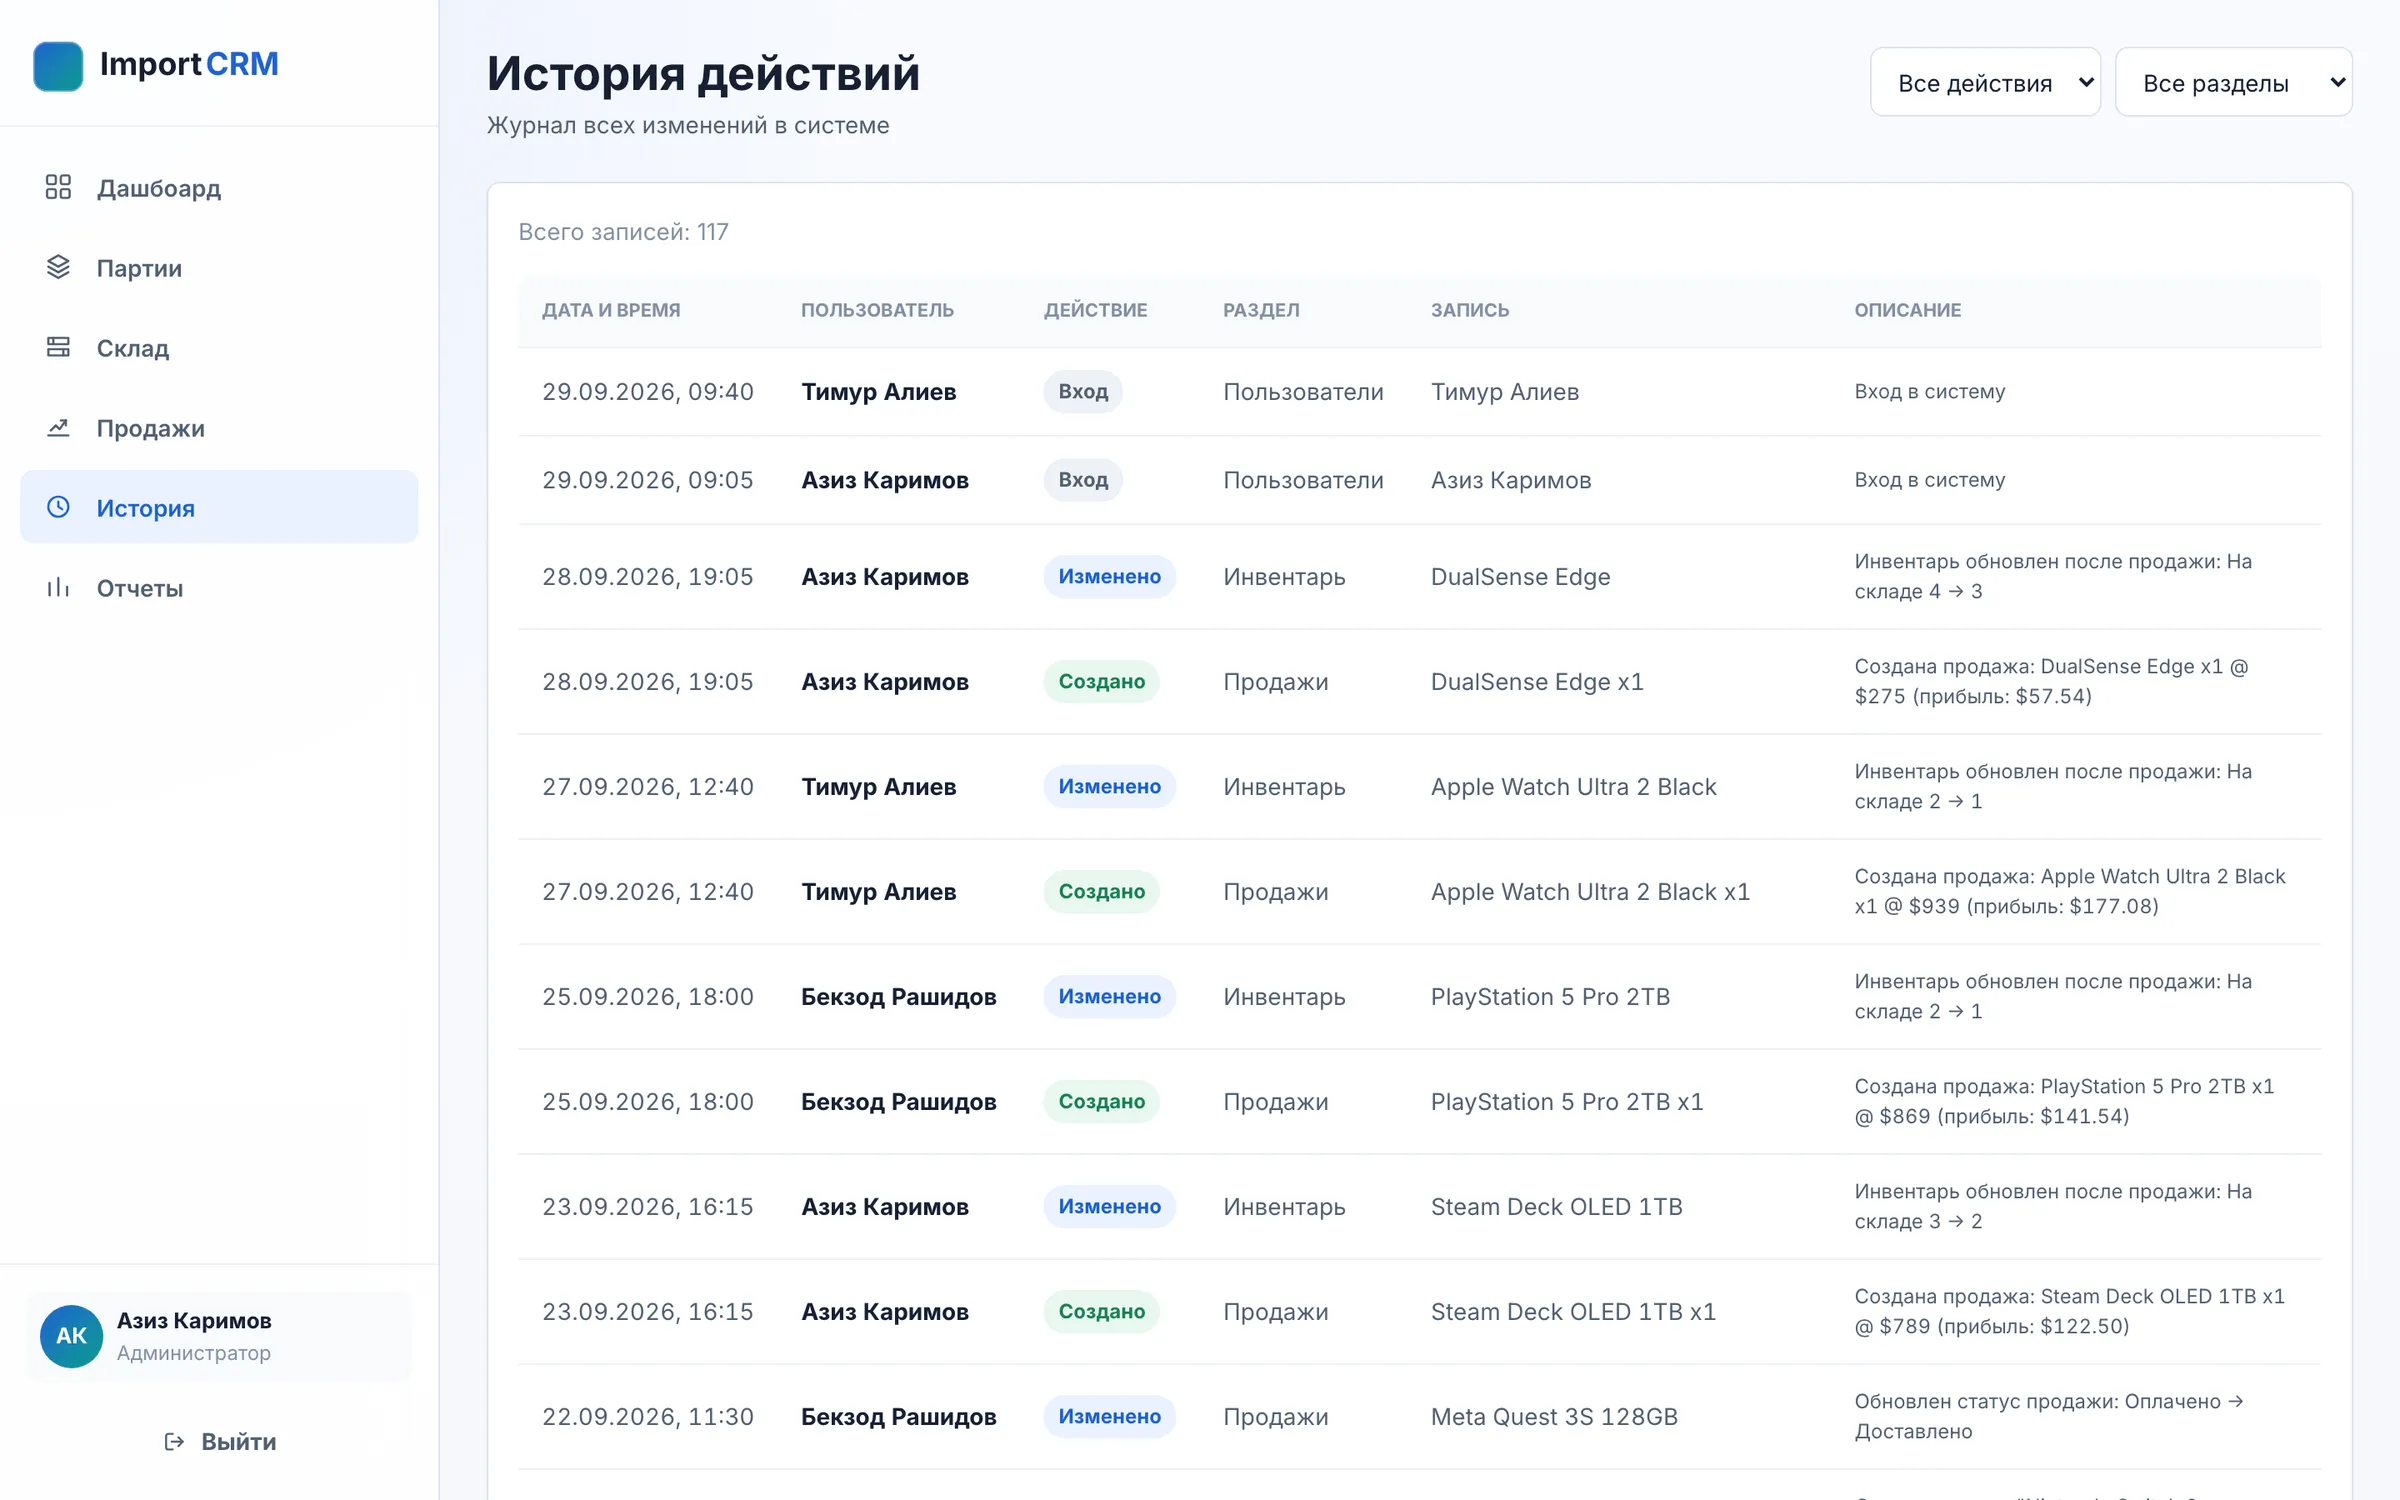
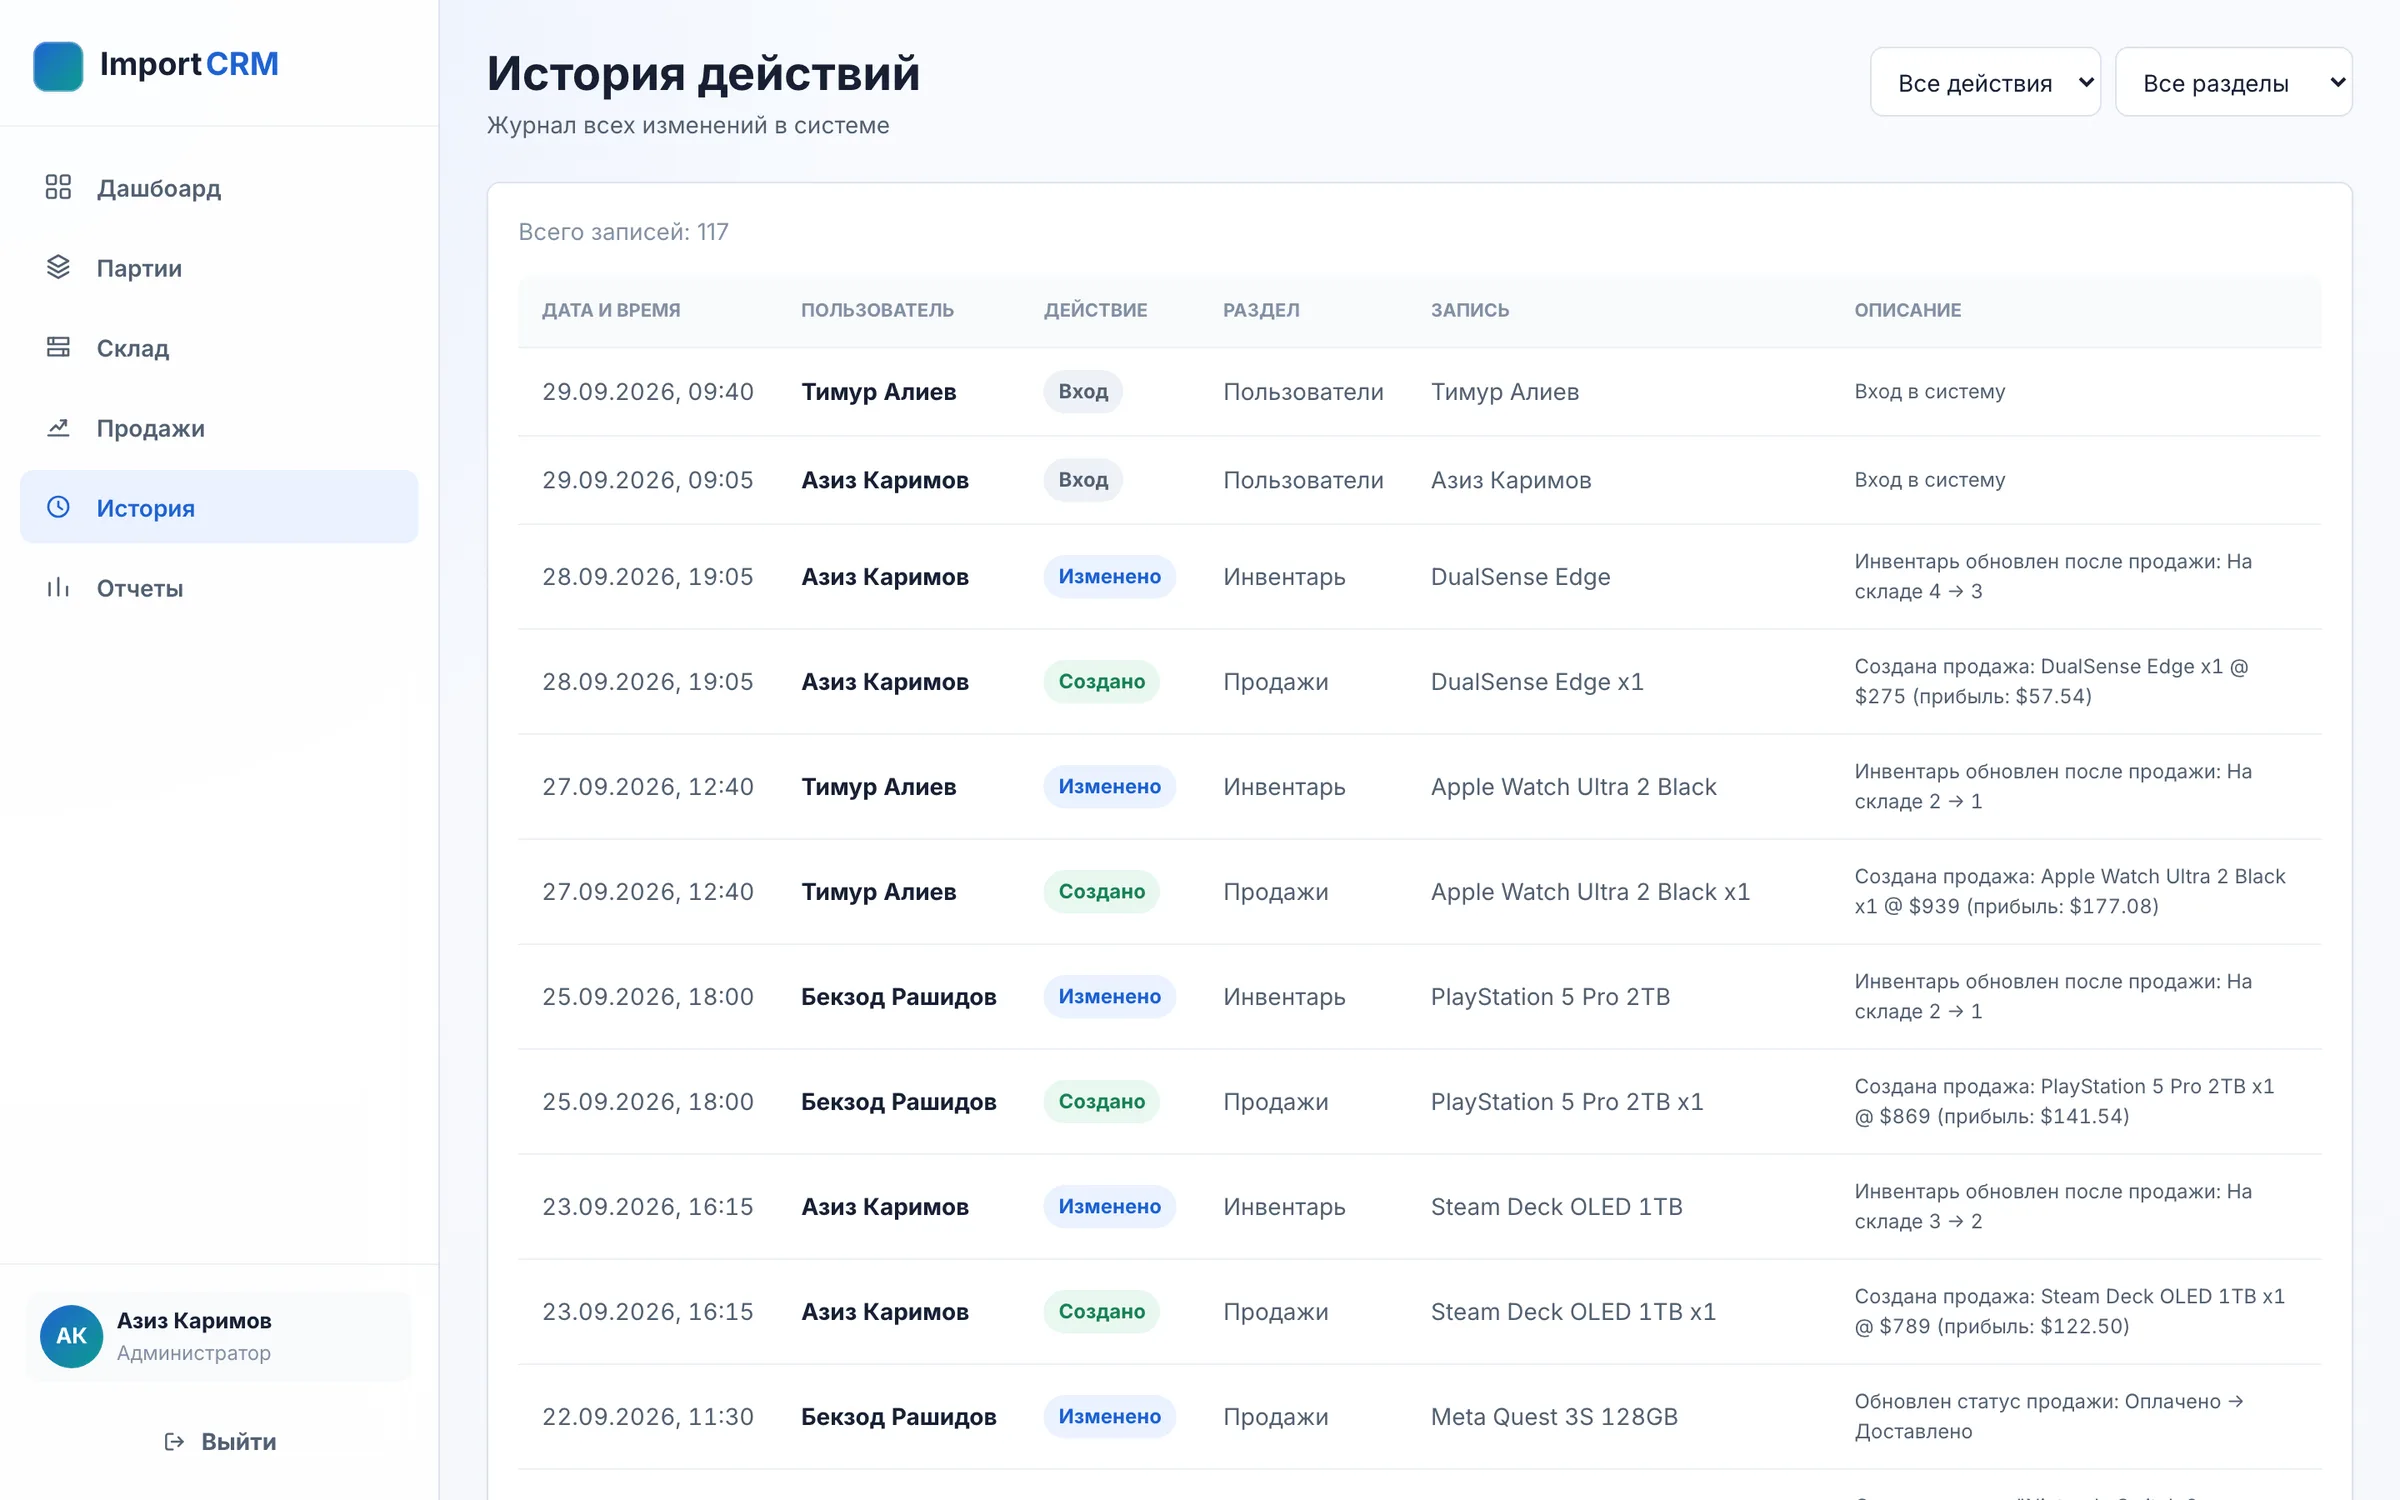
Fig. 4.4 Audit log of which co-owner created or changed what, including the automatic stock updates after each sale. -
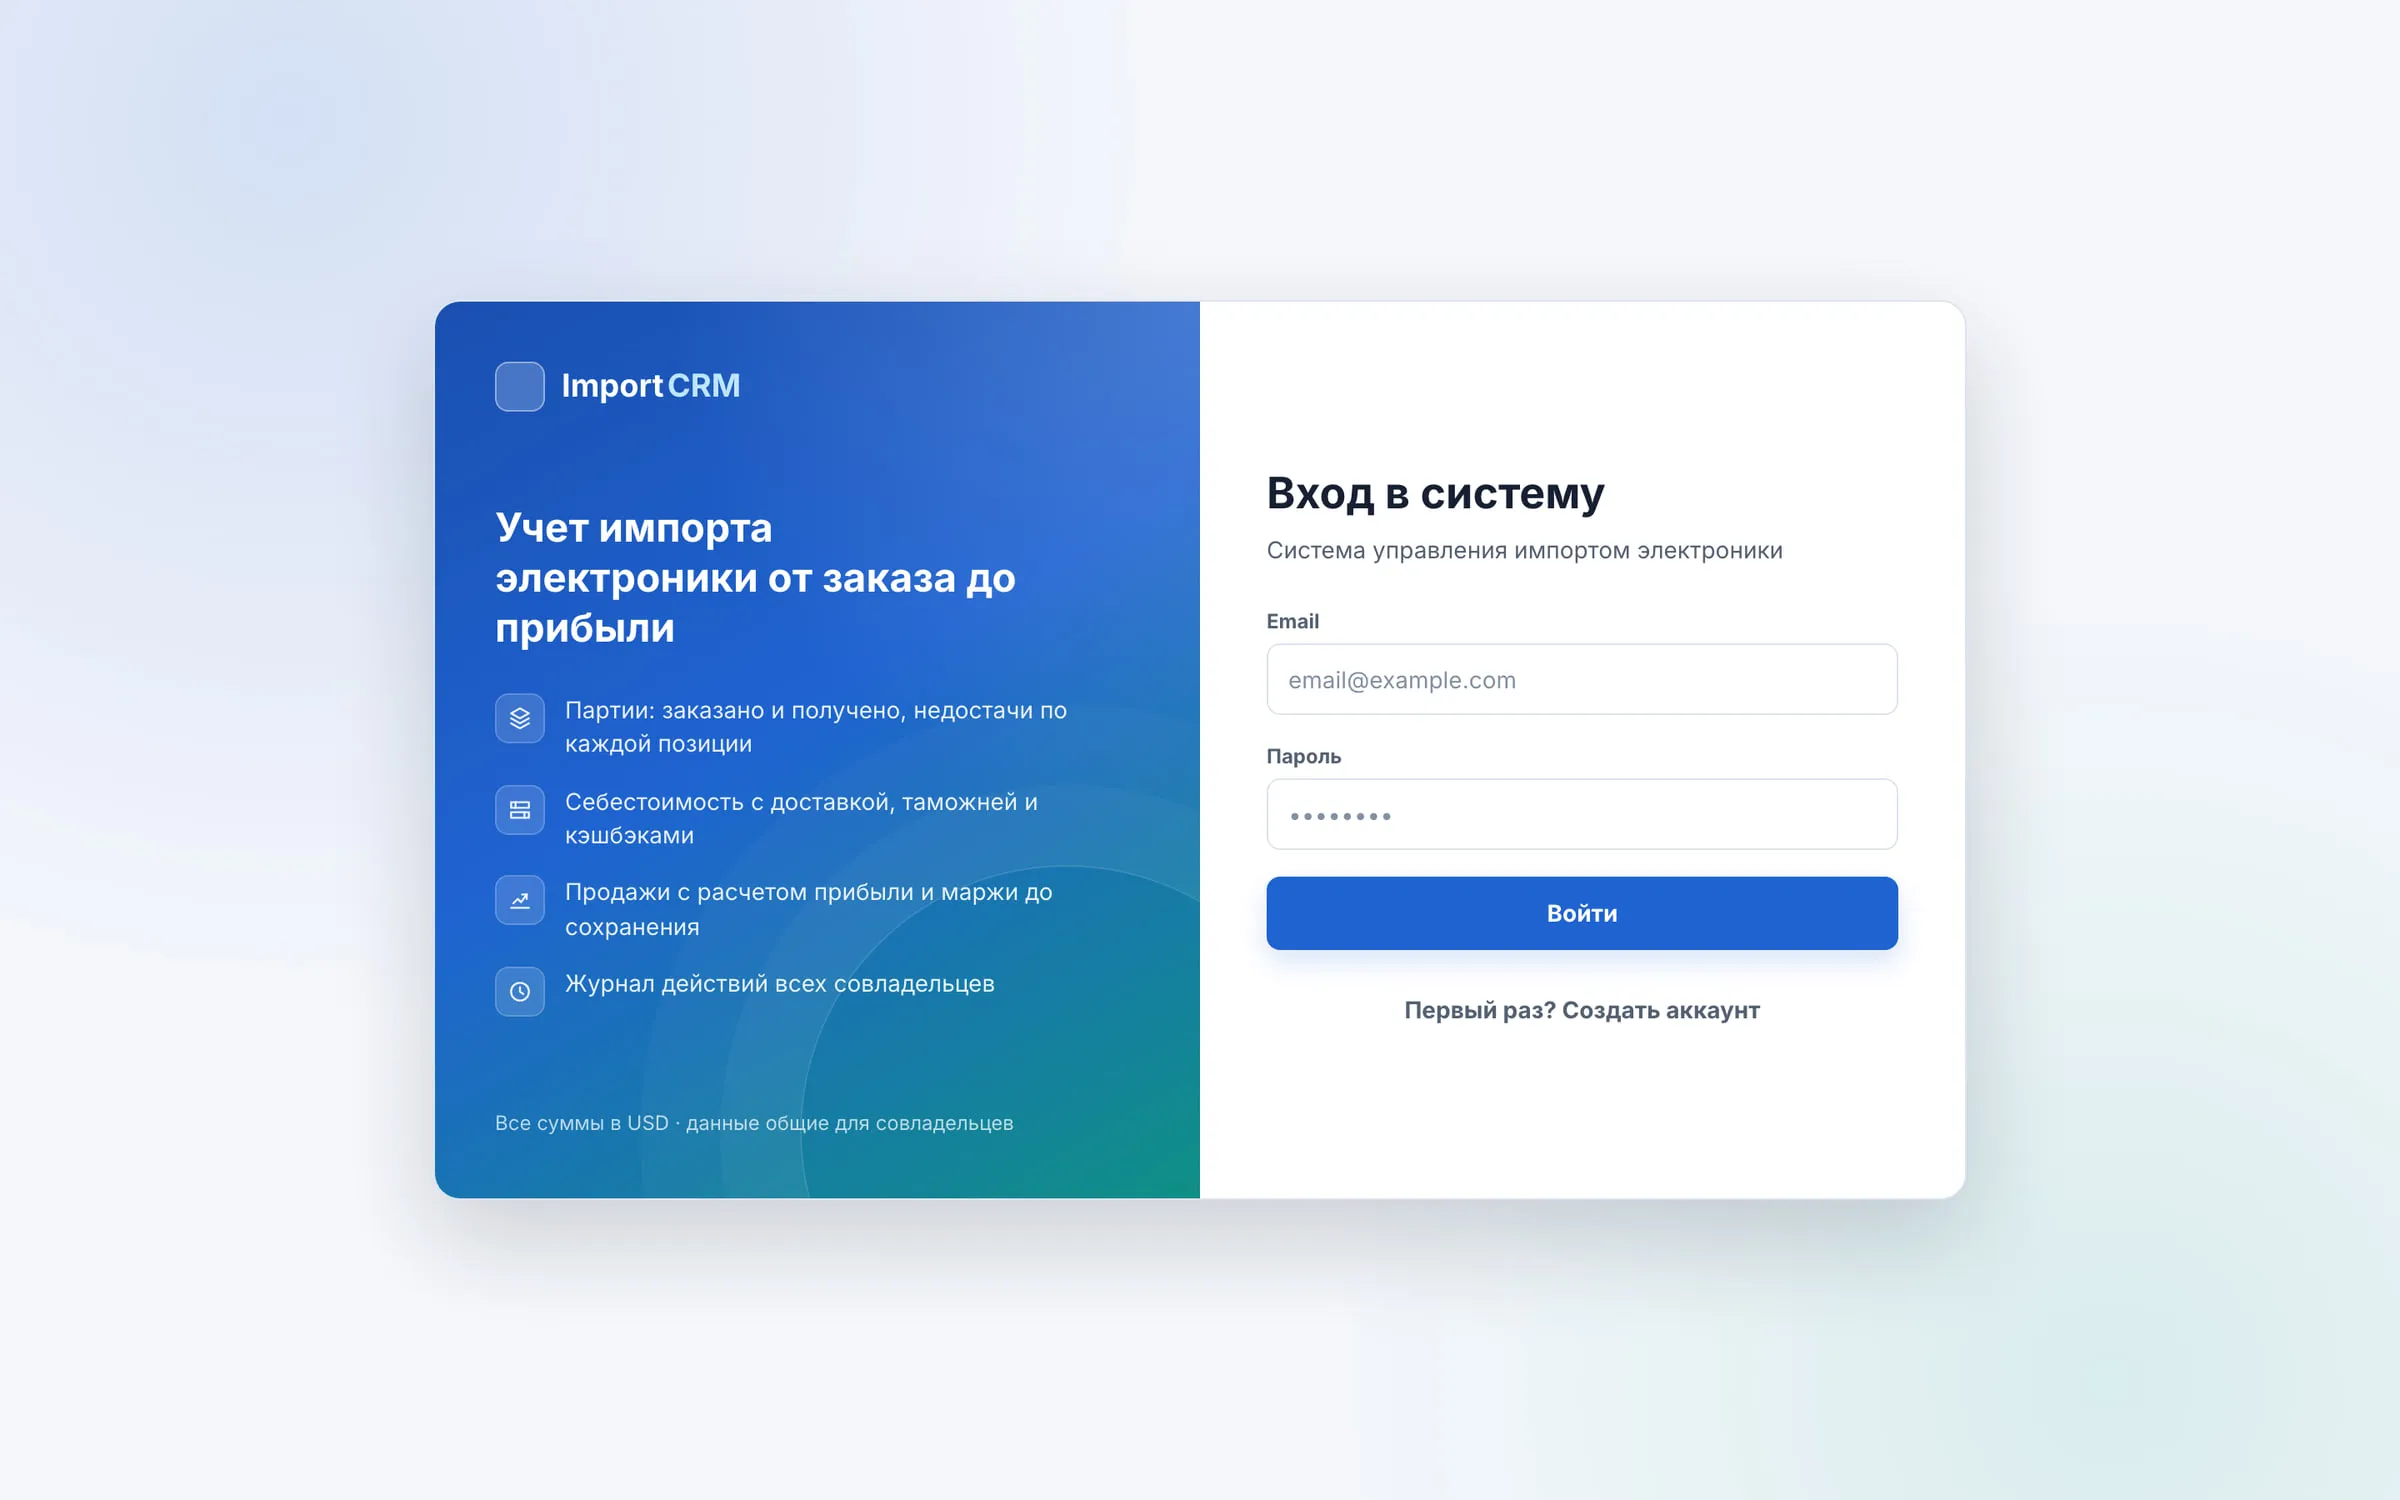
Fig. 4.5 Sign-in screen with an ImportCRM brand panel summarising the main capabilities beside the email and password form.
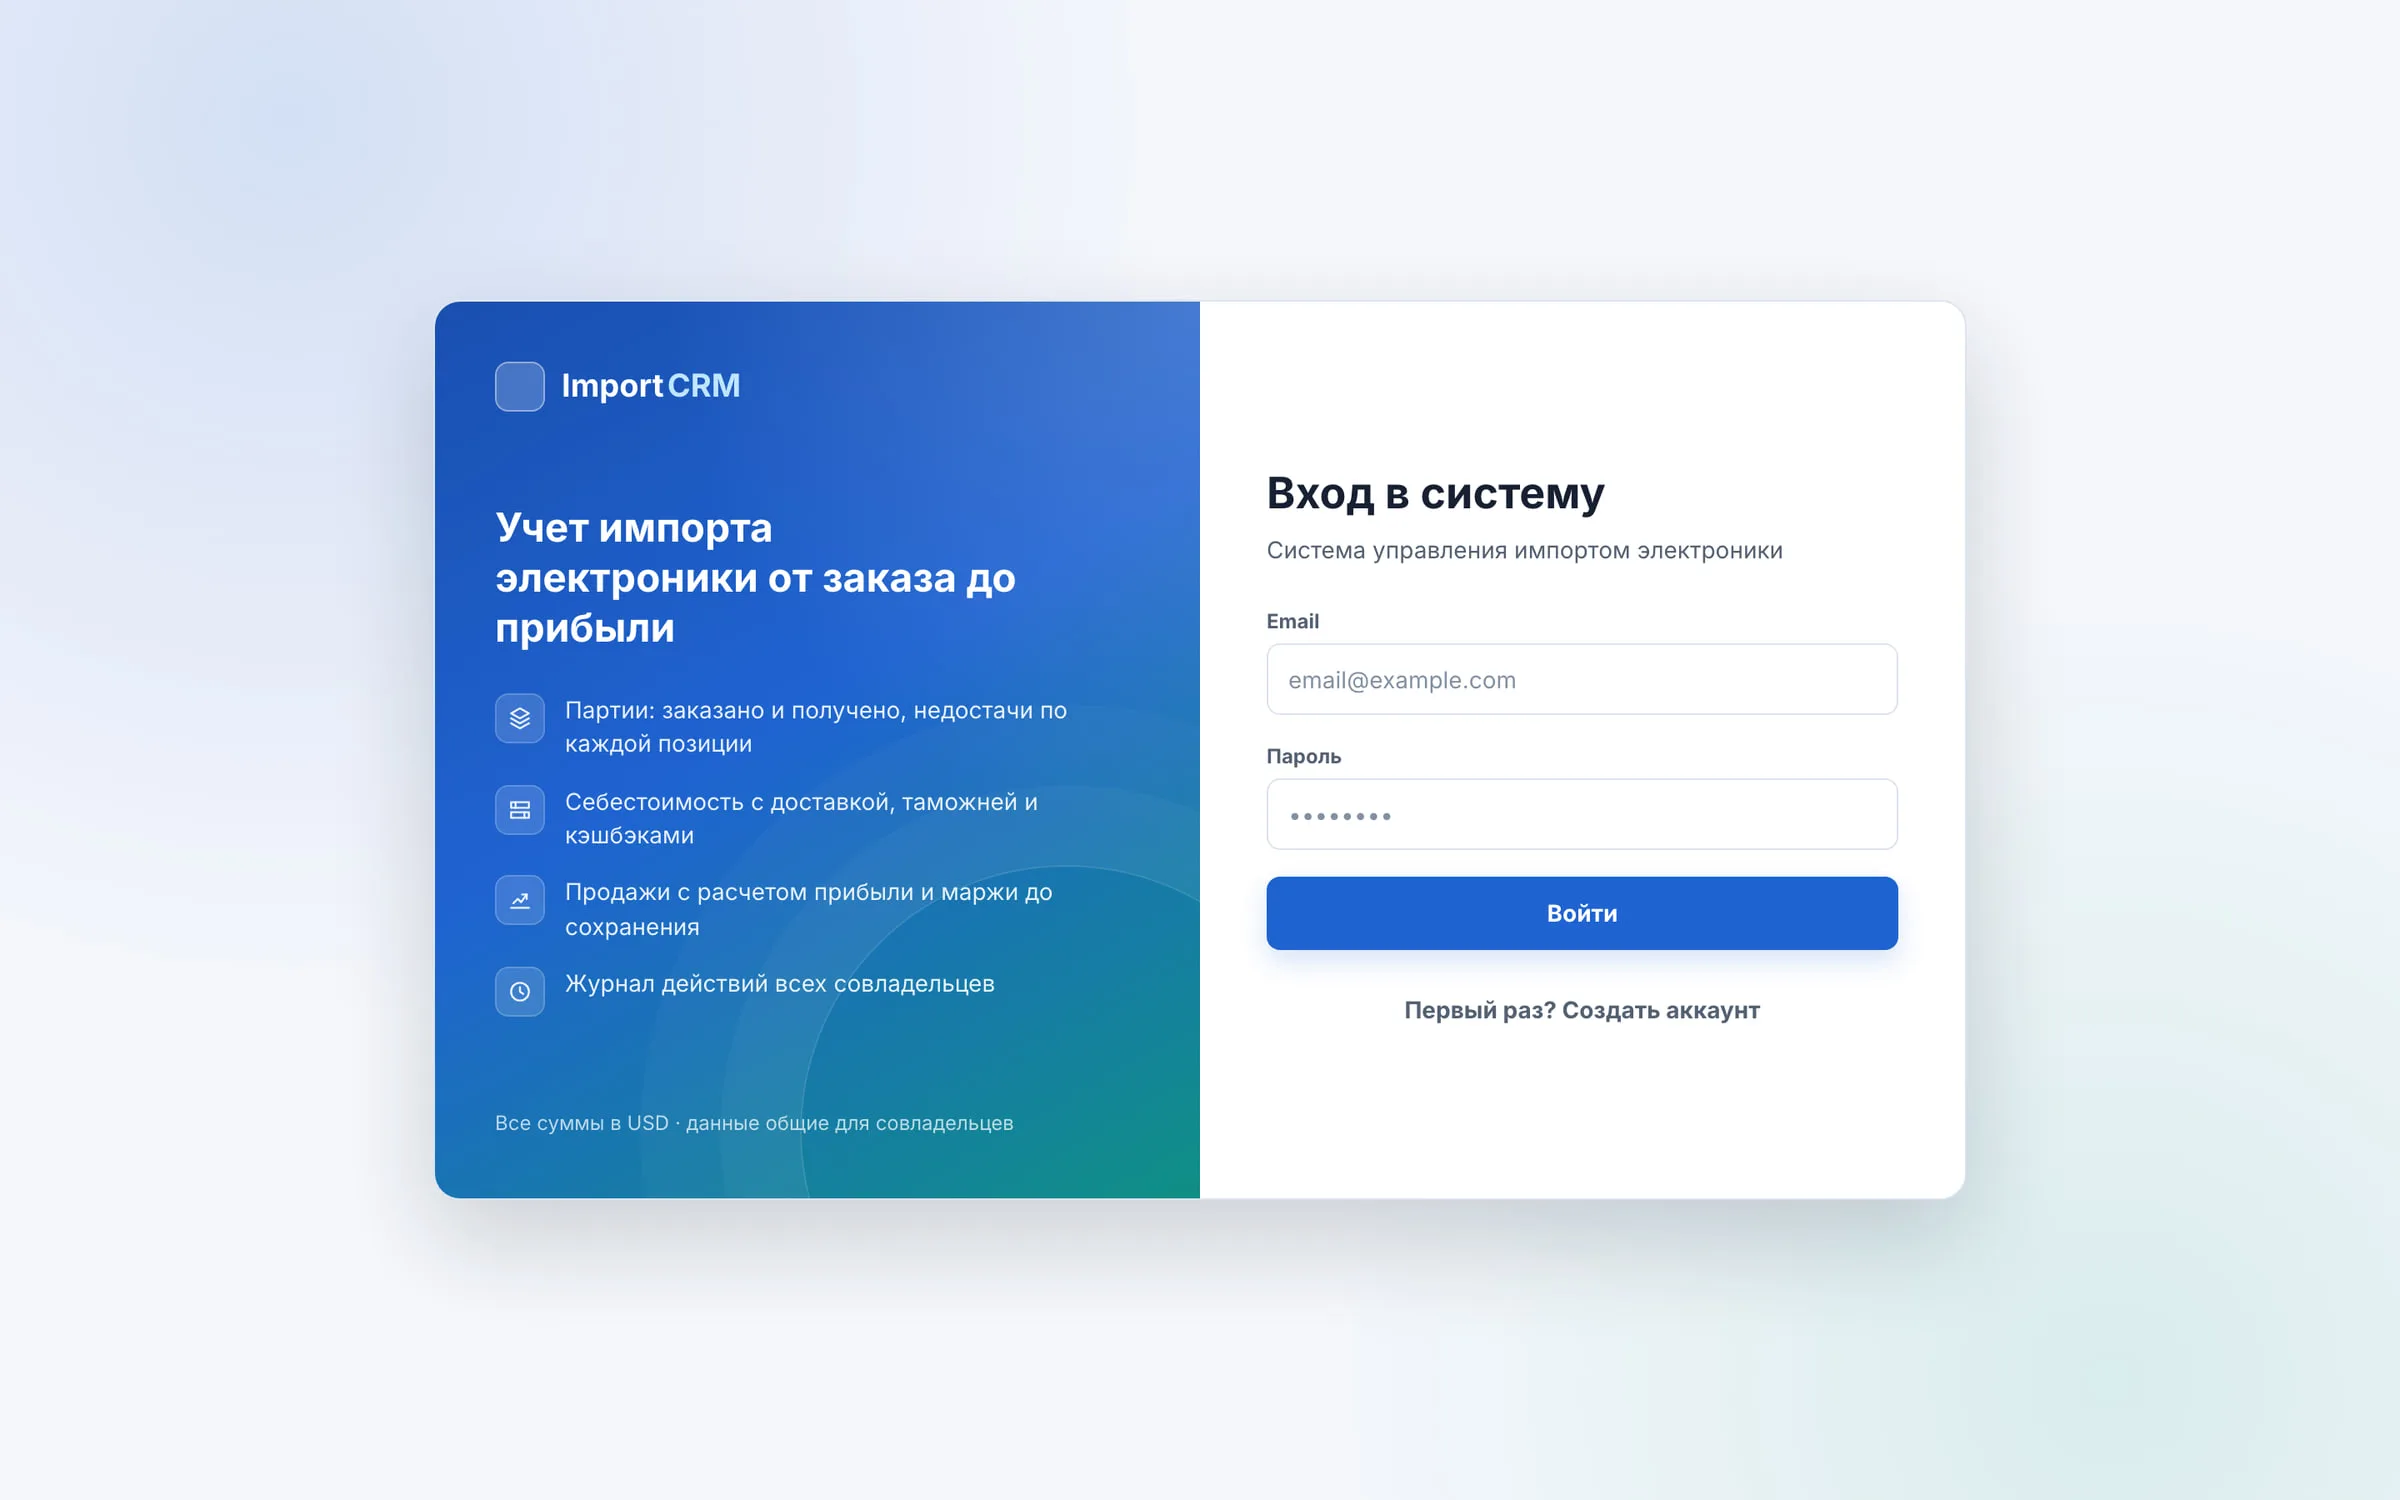
Details — the mobile screens.
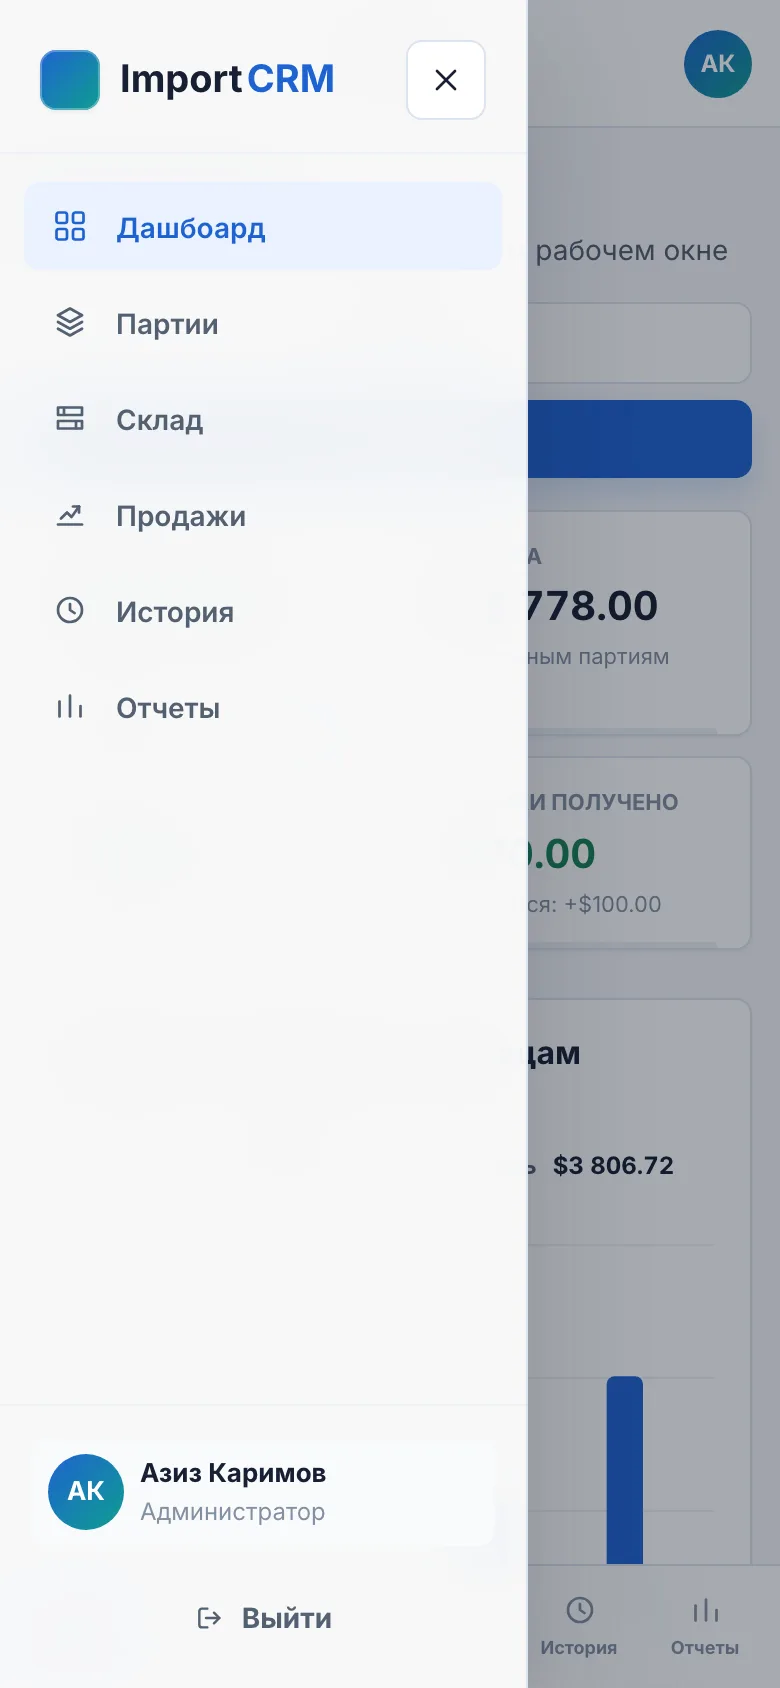
Every mobile screen 04
Materials schedule — the stack, and why.
| Layer | Material | Why |
|---|---|---|
| 01Data | PostgreSQL · Prisma · 9 models | Relational integrity for batches, stock and sales; the same schema runs on SQLite for local demos. |
| 02Logic | Express 4 · landed-cost engine · sale snapshots | Costs recompute on every arrival, expense or cashback; sold units keep the cost they were sold at. |
| 03Intelligence | Rule-based profit and margin preview | Partners see the expected result before committing a sale — plain arithmetic, no guesswork. |
| 04Interface | React 18 · Vite · React Router | One responsive admin: sidebar on desktop; drawer, tab bar and bottom sheets on phones. |
| 05Infra | Vercel static + serverless function · JWT · bcrypt | One deploy for interface and API, with stateless auth that suits serverless. |
Stack
Completion — outcome and links.
Verified facts
- REST endpoints
- 38
- Source: from the repository, Sep 2026
- data models
- 9
- Source: from the repository, Sep 2026
Links
Private
Walkthrough on request
Want to see it running?
I can walk you through the live system on demo data and explain the decisions behind it.
Request a walkthrough